Once you’ve created a Feedback Survey for your conversations based on a survey type (NPS, CSAT, or Like/Dislike), it’s important to constantly monitor and analyze the customer responses, feedback survey scores, and trends over a given period.
Thus, knowing the survey type scores and the key metrics for respondents, responses, trends, and users helps gain actionable insights into the customer experience your business is delivering. The new Feedback Analytics Dashboard under the Analyze section provides prebuilt dashboards to view the survey results and insights based on the duration, survey name, and type you select.
The Dashboard displays graphs and charts derived from real-time feedback data for the following:
- Distribution trends of feedback scores.
- The overall score for the given period and its trend.
- The comprehensive feedback results with an option to export the results for review.
There are two ways to access the Feedback (Analytics) Dashboard:
- On the Bot Builder home page, click on your Virtual Assistant.
- Navigate to Analyze > Feedback Dashboard

Dashboard Filters
The Feedback Dashboard displays analytics data on the Feedback Survey responses from customers based on the following filters:
- Date: Indicates the date range to filter the conversation sessions and capture the survey feedback responses.
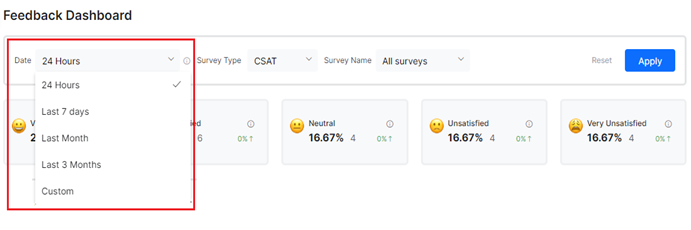
The filter options include the following:
- 24 Hours: Captures feedback survey responses from conversations in the past 24 hours.
- Last 7 Days: Captures feedback survey responses from conversations that happened in the last seven days.
- Last Month: Captures feedback survey responses from conversations in the last month.
- Last 3 Months Captures feedback survey responses from conversations in the last three months.
- Custom: Select the start and end date range on the calendar widget to capture the feedback survey data.

-
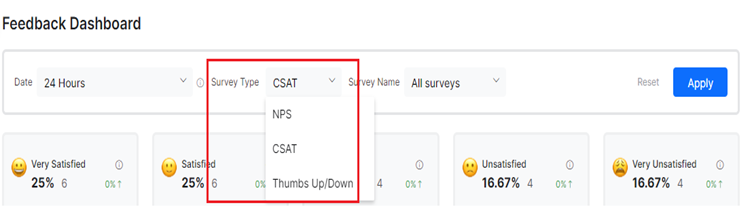
- Survey Type: The type of survey including CSAT, NPS, or Like/Dislike. Learn more.
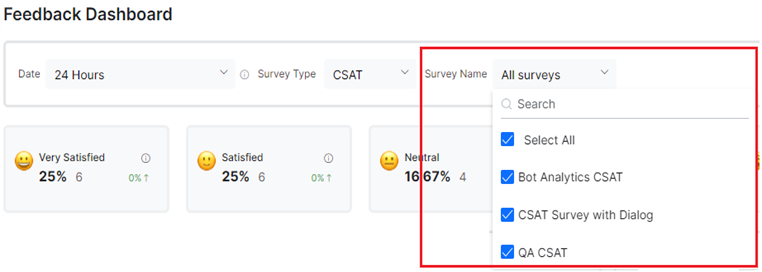
- Survey Name: This is the feedback survey name provided when creating a feedback survey under Build > Configurations > Feedback Survey. You can either select All Surveys to capture the Feedback Survey analytics data of all the surveys configured for the virtual assistant or a specific survey name from the dropdown list.
Dashboard Sections
The Feedback Survey Dashboard is categorized into five sections that display analytics-driven graphs and charts for the selected feedback survey name, survey type, and date based on the captured feedback survey responses. These include:
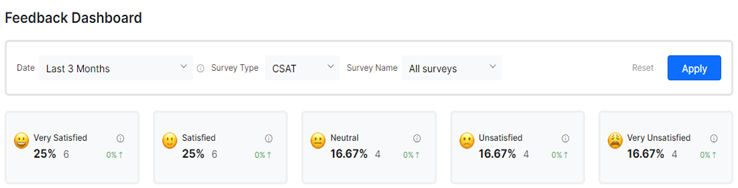
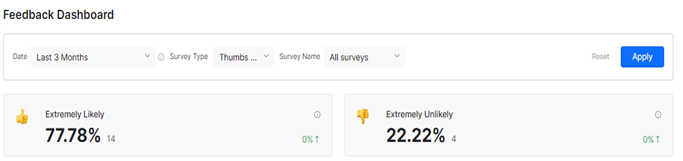
Percentage and Number of Respondents
This widget displays the percentage and the number of respondents for a specific feedback survey response. In addition, it displays the percentage of increase or decrease in the individual response type over the given period.
For the NPS survey type, it captures the data for the following responders:
- Promoters: Respondents who gave a score of 9 or above.
- Passives: Respondents who gave a score between 6 and 8.
- Detractors: Respondents who gave a score between 0 and 5.

For the CSAT survey type, it captures the data for the following responses:
- Very Satisfied: Respondents who gave a score of 5.
- Satisfied: Respondents who gave a score of 4.
- Neutral: Respondents who gave a score of 3.
- Unsatisfied: Respondents who gave a score of 2.
- Very Unsatisfied: Respondents who gave a score of 1.
For the Like/Dislike survey type, it captures the data for the following responses:
- Extremely Likely: Respondents who gave a score of 1.
- Extremely Unlikely: Respondents who gave a score of 0.
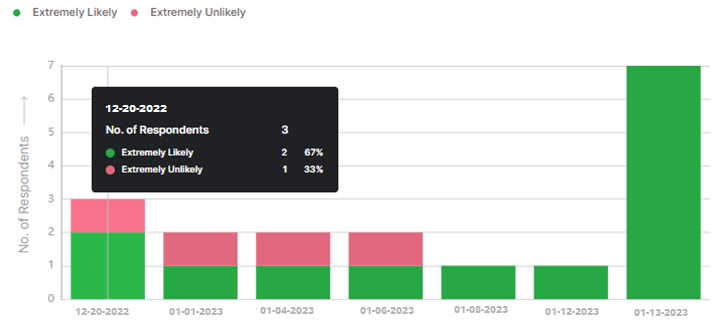
Score Break up – Respondent-wise Survey Score over Time
This section displays the bar chart widget representing the percentage of each response type for Like/Dislike and CSAT surveys and the respondent type for NPS surveys over a time period.
For the NPS survey type, the number of promoters, passives, and detractors is displayed in different colors over the selected period on the days they responded.

For the CSAT survey type, the number of very satisfied, satisfied, neutral, unsatisfied, and very unsatisfied responses received over the selected date range is displayed in different colors.

For the Like/Dislike survey type, the number of extremely likely and extremely unlikely responses captured over the selected date range is displayed in different colors
Survey Score
This section displays the meter graph (from 0 to 100) widget for the survey score based on the actual customer feedback survey responses for a specific survey type. Each score graph is generated based on an internal formula mapped to a survey type as follows:
-
- NPS Score: Displays a whole number between -100 and 100 based on the formula
(Percentage of Promoters - Percentage of Detractors).
- NPS Score: Displays a whole number between -100 and 100 based on the formula

-
- CSAT: Displays the percentage value based on the formula
(Number of very satisfied/satisfied Respondents / Total Number of Respondents) * 100.
- CSAT: Displays the percentage value based on the formula

- Like/Dislike: Displays the percentage value based on the formula
(Number of extremely likely Respondents / Total Number of Respondents) * 100.

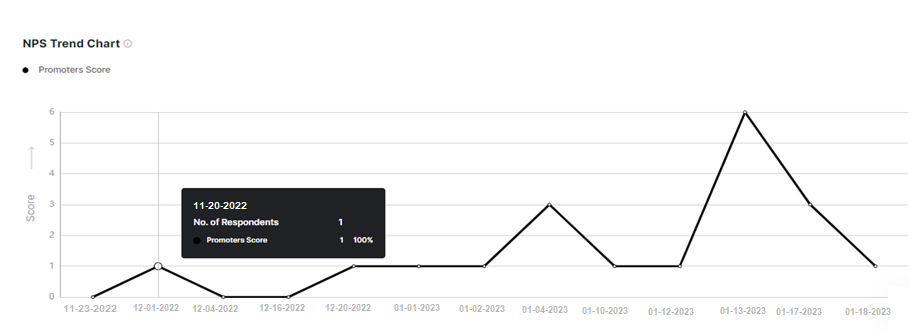
Survey Trendline
This section displays the widget with the line graph capturing the date-wise response score trend for the total number of positive respondents over the selected date range.
For the NPS survey type, the line graph displays the Promoters score trend changes for the total number of promoters over the selected period.
For the CSAT survey type, the line graph displays the Respondents Score trend changes for the total number of very satisfied and satisfied respondents over the selected period.

For the Like/Dislike survey type, the line graph displays the respondents’ score trend changes for the total number of extremely likely respondents over the selected period.

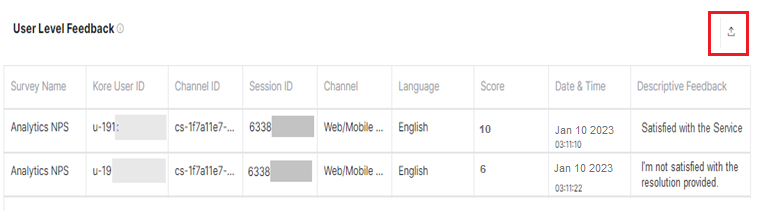
User-level Feedback
This information grid represents the metadata for the Total number of conversations for every unique conversation path between the virtual assistant and the user. This grid summarizes and lists the data of all the feedback surveys mapped to the selected survey type filter. The fields for which data is displayed are:
Field NameDescription
| Survey Name | The name of the feedback survey for the selected survey type. |
| Kore User ID | The internal ID of the user who responded to the survey. |
| Channel ID | The channel ID of the conversation session channel. |
| Session ID | The identifier of the conversation session. |
| Channel | The conversation channel of the user and virtual assistant interaction. This can be a web/mobile client or a messaging platform. |
| Language | The language used to communicate during the conversation session. |
| Score | The feedback survey score. |
| Date & Time | The date and time of the interaction. |
| Descriptive Feedback | The user’s response to the follow-up question was triggered during the feedback survey.
Note: This value appears only if a follow-up question is configured for a survey. |
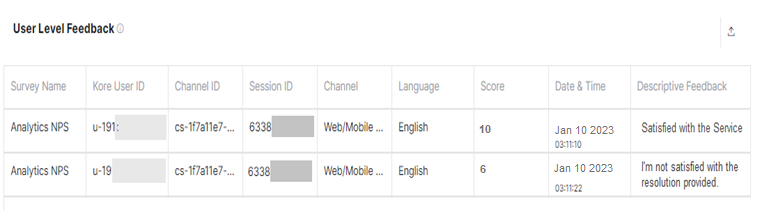
Download the Feedback Analytics Report
To download the User-level feedback report, click the Export to CSV icon as shown below: