Introduction
The Flow Health dashboard summarizes how well the flows of Virtual Assistant (VA) are performing and shows the coverage of intents and transitions in the bot definition. The Flow Health dashboard displays the overall pass or fail percentage of test cases with options to view the transitions coverage.
The Flow Health dashboard also shows the summary of user intents that are covered and missed in test cases. You can review the uncovered intents and add relevant test cases to cover missing user intents in the test suite.
You can also use the test result analysis to identify the issues in the dialog task definitions and fix them with actionable recommendations to improve overall NLU and Flow health.
Note: The Flow Health Dashboard is available on the XO Platform version 10.0, released on Jan 21st, 2023.
Use-Case Scenario
In this article, the Hotel Booking virtual assistant is used as an example to understand the flow of transitions and test results analysis. The Hotel Booking VA has the Search A Hotel, Book a Hotel, Get User Data, Show User Data, and Raise Complain dialog intents with various test cases in the test suites in the Conversation Testing module.
A transition shows how a user intent is transferred from one node to another node in a dialog task. A transition is a flow of intent between two nodes. It has a From node and a To node. For example, “Book a Hotel ” is a user intent in a dialog task. A city is an entity node in the dialog flow to which the book a hotel user intent is transitioned, and then it transitions to the state node. From the state node, it transitions to country and reservemessage nodes. Therefore, in the Book a Hotel task, you have four transitions in total. For more information, see User Intent.![]()
Once you record a conversation flow, save it and run it in the Conversation Testing module. The conversation testing module helps in knowing how a dialog task performs. For example, if you have a Get User Data dialog task and want to see how this dialog task is performing, you can create a Show User Data test suite with various test cases. Run the Show User Data test suite and see whether it was completed successfully, failed, paused, or not executed. For more information, see the Conversation Testing article.
The test suite results are tracked in the Conversation Testing, and the analytics for test suites are displayed in the Flow Health dashboard.
How to Use the Flow Health Dashboard
To access the Flow Health Dashboard, follow these steps:
- Navigate to BUILD > Testing > Health & Monitoring and select the Flow tab.
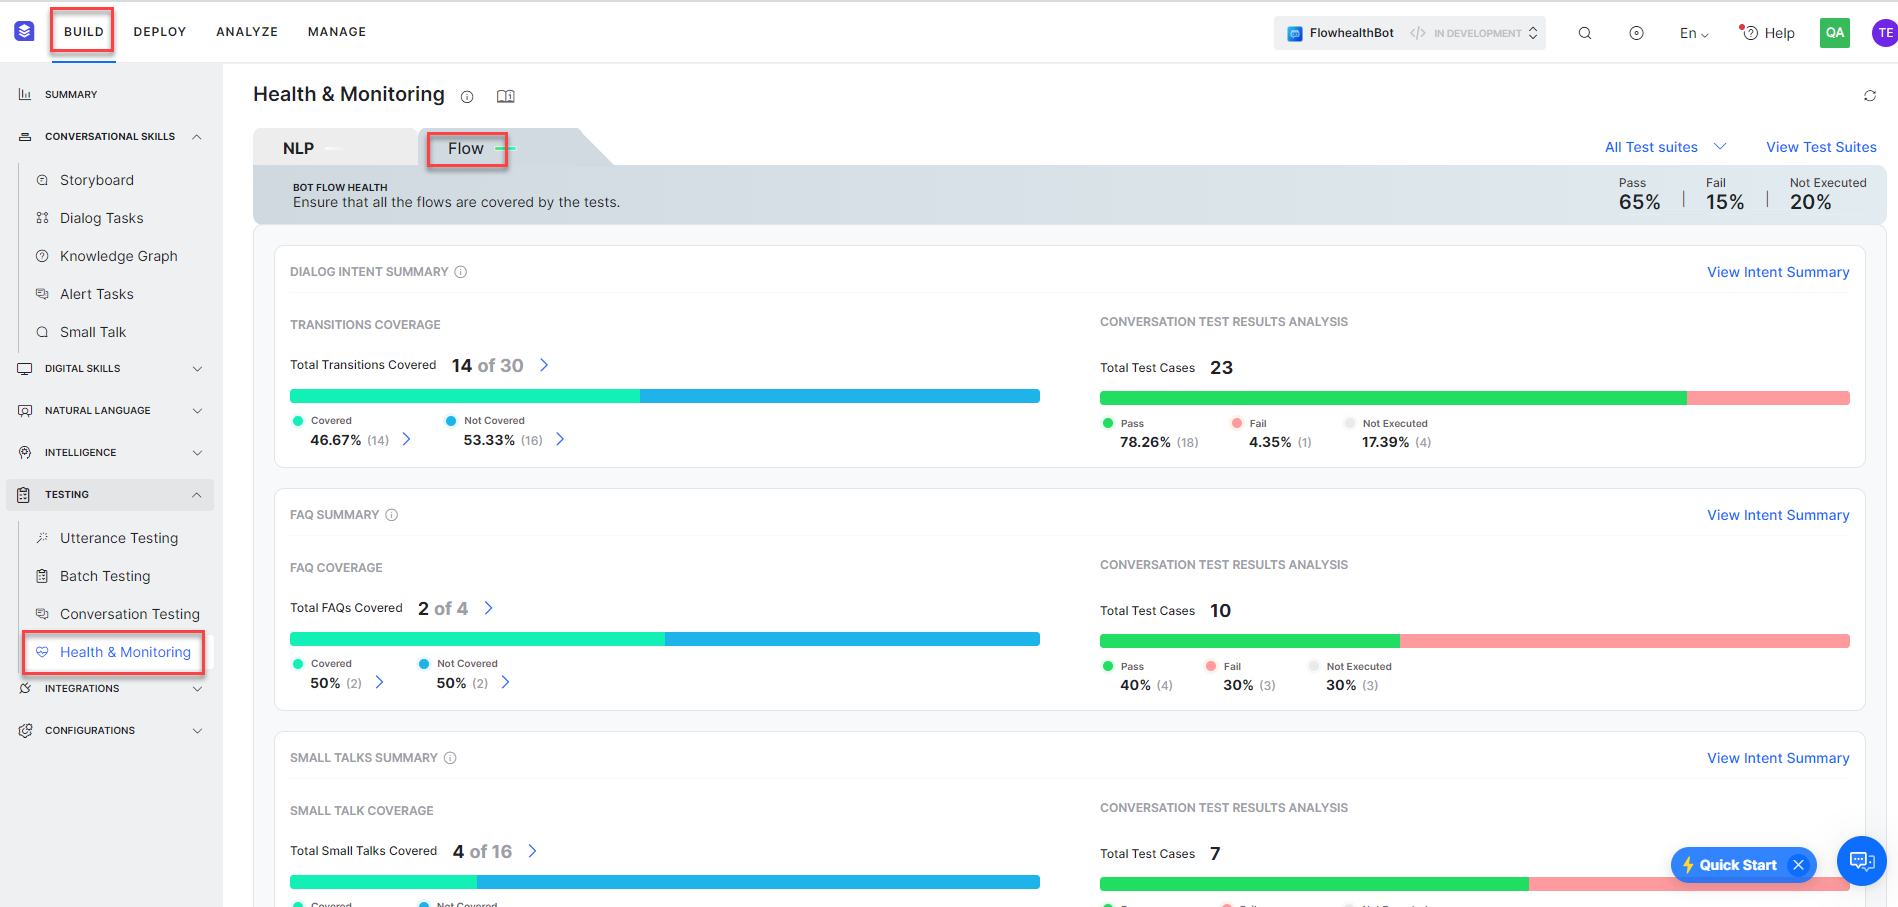
- Drill down to learn how to view the Dialog Intent, FAQ, and Small Talk summary sections. In these sections, you can view the intent level summaries, along with test coverage details to easily identify the transitions or intents to be covered. You can also expand to the test case results to view the execution analytics.
Note: The test suites are used to verify the Intents, Small Talks, FAQs, and Standard Responses with test cases. The Flow Health dashboard considers standard responses in test cases to calculate overall percentages. However, the dashboard has no separate summary tile for the Standard Responses. For this reason, you will notice a slight difference in the test results’ overall count or percentage.
Flow Metrics
The Flow Health dashboard extrapolates all test suite results from the conversation testing and presents insights into your test cases with performance analytics.
View the overall percentage of the test case results in the test suites with the following flow metrics:
- Pass – Total Number of test cases passed across all test suites.
- Fail – Total Number of Test cases failed across all test suites.
- Not Executed – Total Number of Test cases aborted or not executed before execution across all test suites.

- Click the View Test Suites link to view all the test suites that are considered in the VA with the following details:
- Test Suite – The name of the test suite.
- Result – The result of the test suite, such as Passed, Failed, Aborted, or Not Executed.
- Duration – The duration for the execution of the test suite.
- Test Cases – The number of test cases in the test suite.
- Pass – The number of test cases that passed.
- Fail – The number of test cases that failed.
- Not Executed – The number of test cases that are not executed.
- Pass percentage – The overall pass percentage of the test cases.

- Click the Test Suite Name to analyze how the test suite is performing. For example, click the FAQ_TS_Pass test suite to view the test results analysis as shown below:

- Select the Test Coverage tab to view the Dialog Intents, FAQs, and Small Talks covered and that are not covered in the test suite.
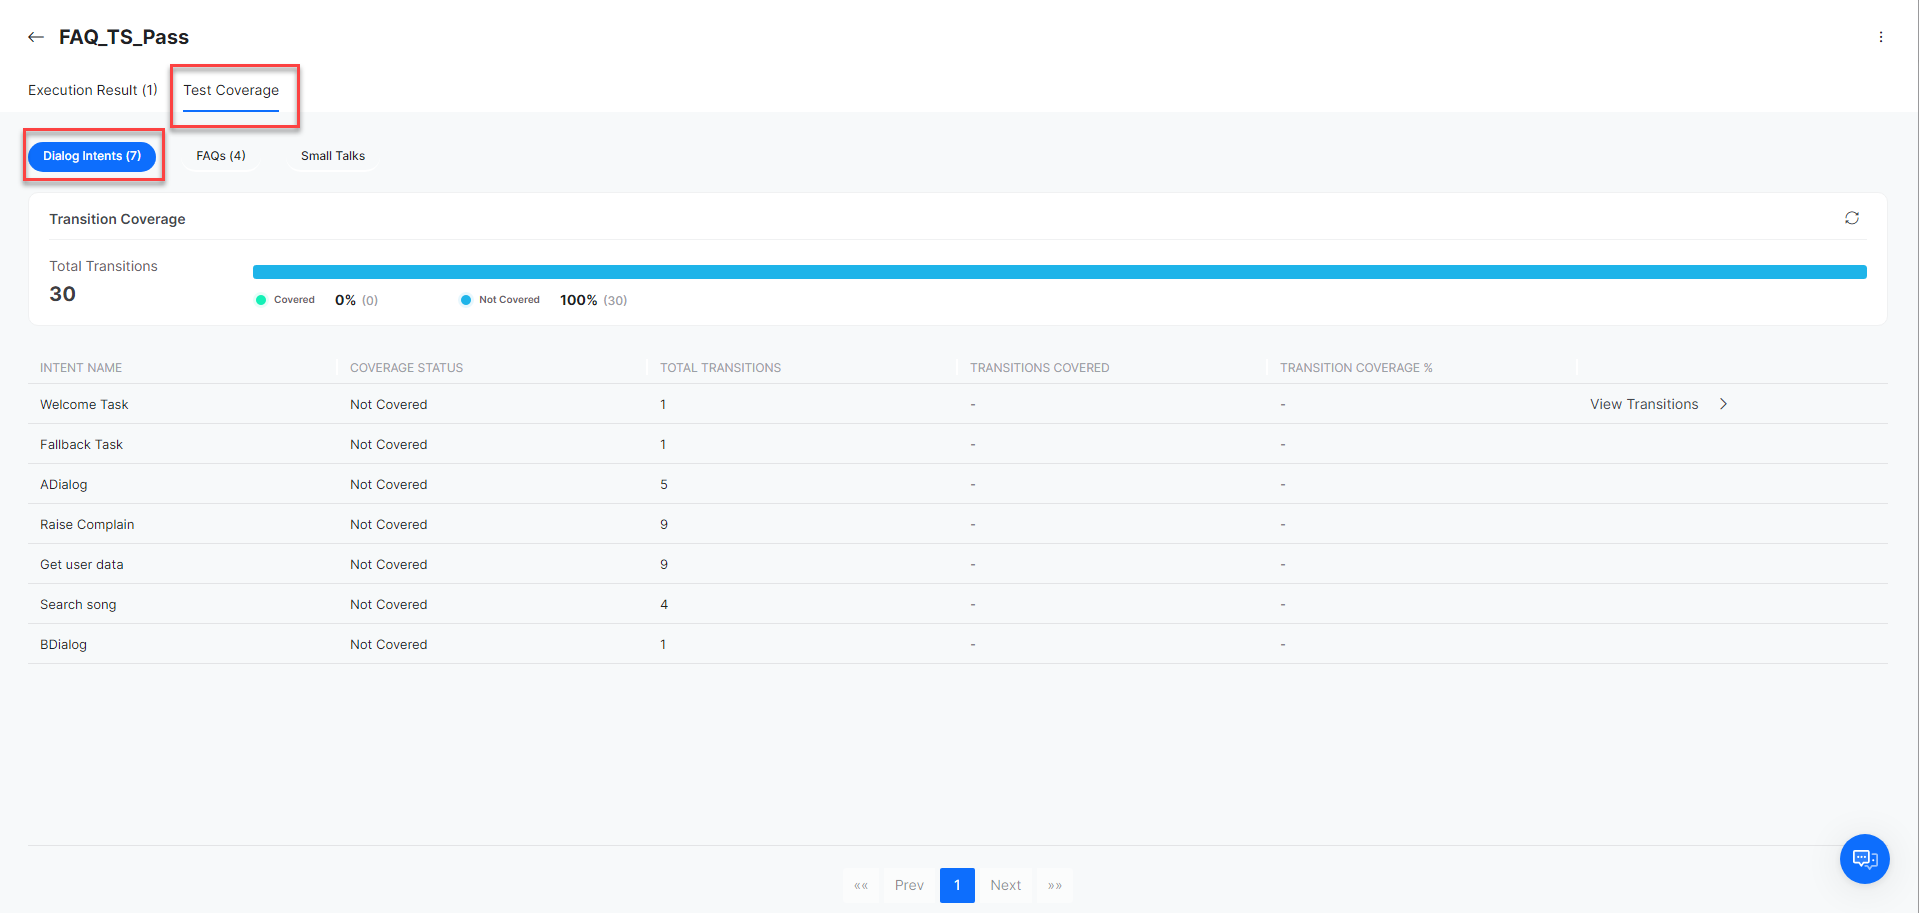
- By default, the Dialog Intents are displayed. Click the FAQs to view FAQs details.

- Click the Small Talks tab to view small talk details.

- Click the X icon to close the Intent Details window.
Flow Dashboard Components
The key components of the Flow Health dashboard include transition coverage and intent summary panels for the test suites. The details on the available panels are explained below.
Dialog Intent Summary
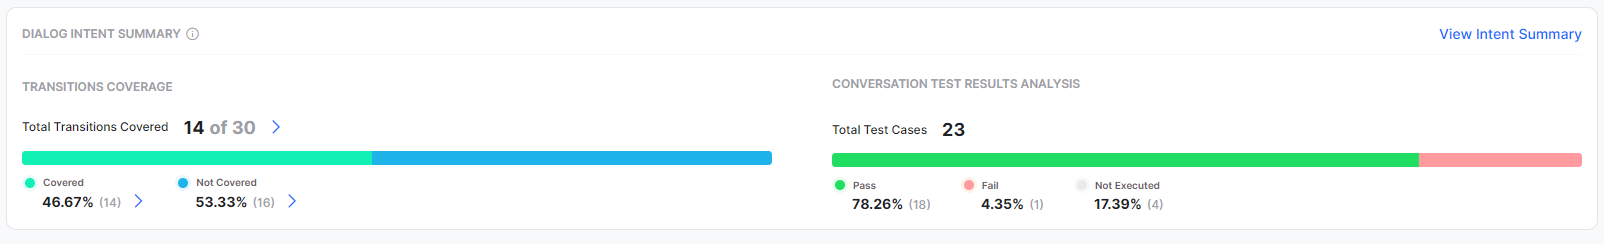
The Dialog Intent Summary shows the summary of test results analysis of dialog intents in the test cases from the Conversation Testing. The Dialog Intent summary also provides insights into flow transitions that are covered and ones that are missed.
In the Dialog Intent Summary region, you can view flow transitions and test result analysis-level summaries, along with the test coverage, to easily identify intents to be covered. You can drill down to view the analytics of test results.
Note: All the test cases across test suites expecting a dialog node for assertion are considered for generating the flow summary.
Transitions Coverage
The Flow Health dashboard calculates the number of transitions in a dialog and shows the analysis of covered and not covered transitions. The Transition Coverage section helps you quickly understand how transitions are performing and fix issues in the specific transitions with actionable recommendations. You can analyze the transitions that are missed and add relevant test cases in the test suite to cover them in multiple iterations.
The percentage of transitions coverage is displayed as follows:
- Total Transitions Covered – Shows all covered transitions out to total transitions in the VA definition.
- Covered – Shows the number of transitions that are covered in the test cases.
- Not Covered – Shows the percentage of total transitions that are not covered in the test cases.
-
- Click the
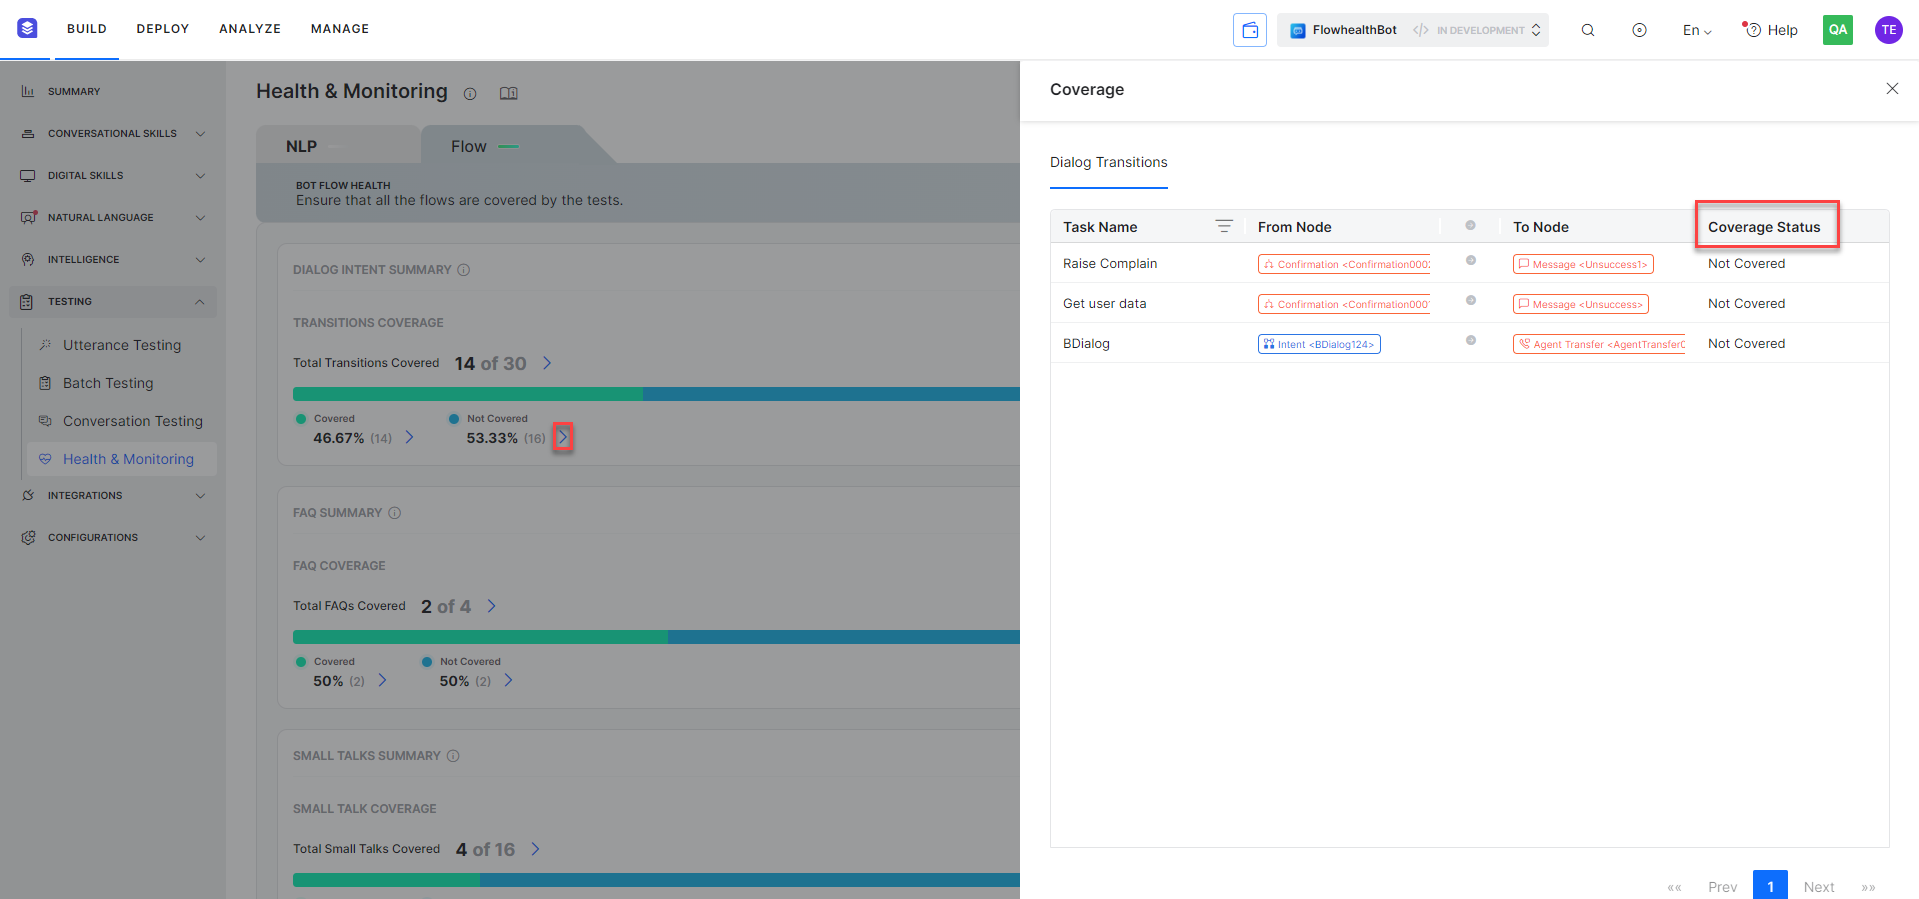
 icon beside the percentages to open the Dialog Transitions page and view the following details:
- Task Name – The name of the dialog intent.
- From Node – The From node where the conversation starts to transition.
- To Node – The To node from where the conversation is transferred to.
- Status – The Status of the transition – covered or not covered.
- Click the icon beside Not Covered percentage to view missed transitions.
- Create a new test suite and record missed transitions to cover them. For more information, see Conversation Testing.
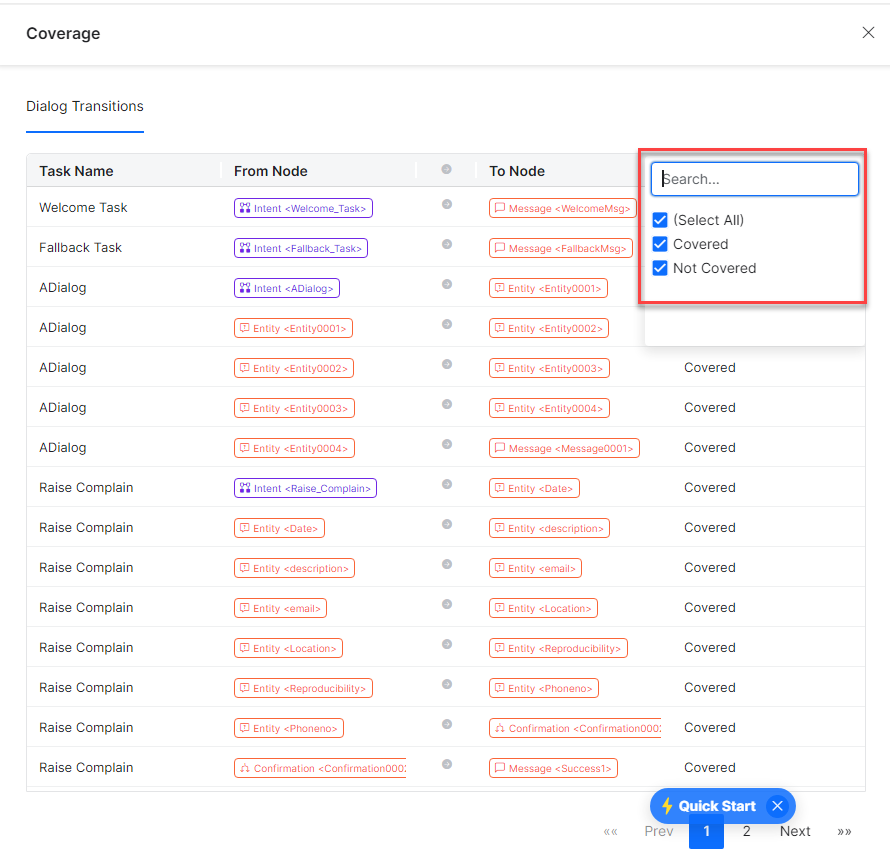
- Click the
 icon to search and filter the dialog intent tasks for which you want to see the transitions coverage. You can filter transitions using the From Node, To Node, and Coverage Status filters.
For example, in the Status Coverage column, click the to select all, covered, and not covered statuses, as shown below:
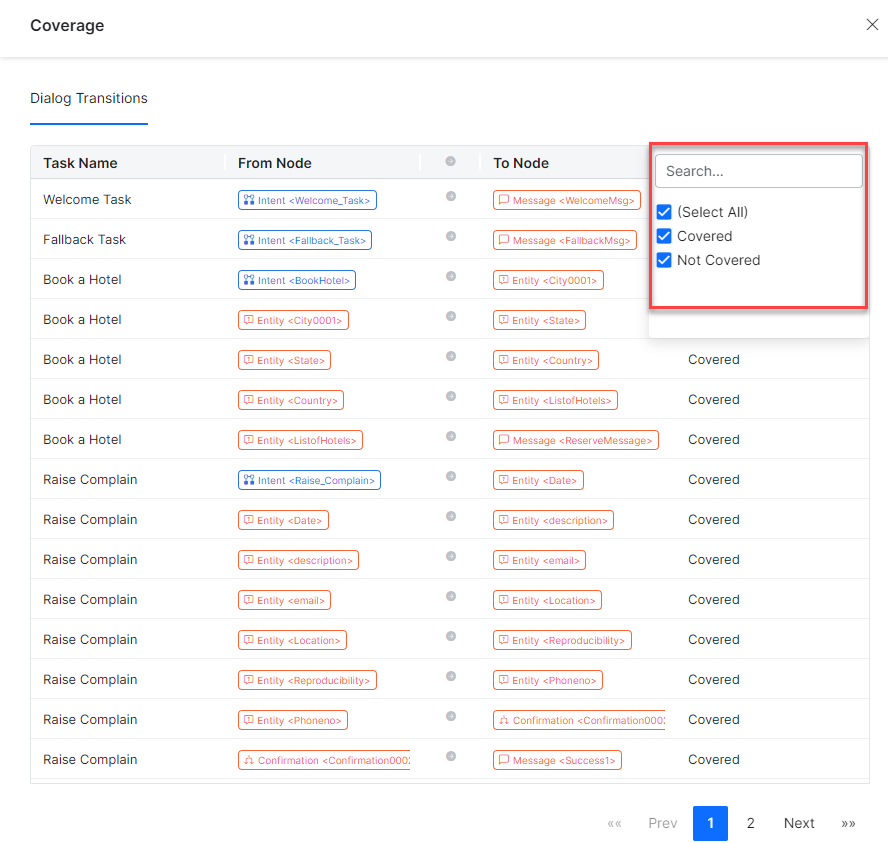
- Click the X icon to close the Dialog Transitions window.
- Click the
Conversation Test Results Analysis
The Conversation Test Results Analysis section summarizes all test suite results. You can use the test result analysis to identify the issues in the dialog task definitions and fix them.
The percentage of test results analysis is displayed as follows:
- Total Test Cases – Shows the total number of test cases in a test suite.
- Pass, Fail, or Not Executed – Shows the count and percentage of test case results that have passed, failed, or not executed.

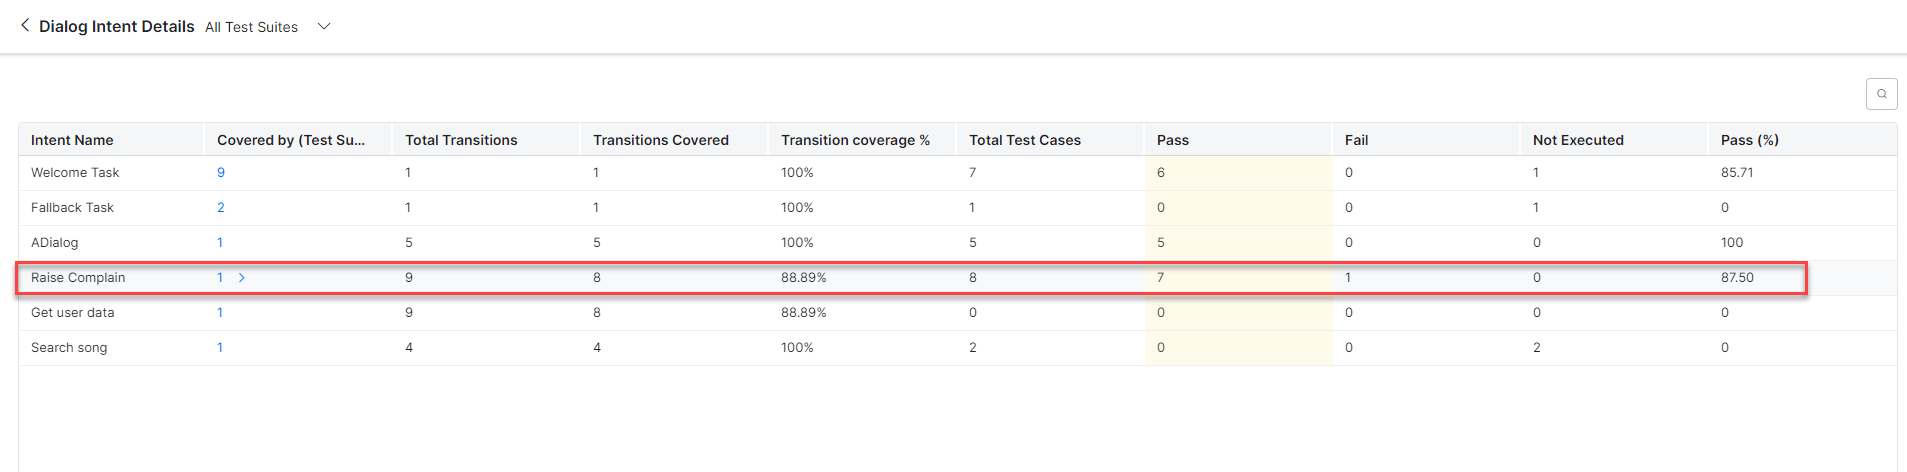
View Intent Summary
The View Intent Summary shows how well test cases are covering and performing at the intent level, making it easier to identify the most important failing and less-covered intents.
- Click the View Intent Summary link to view the intent details in the Dialog Intent Details view.

- Once you click the View Intent Summary link, the Dialog Intent Details displays all intents that are covered in a test suite.
This summary shows the intents covered in the test suite with the total number of transitions that are covered and missed. It also shows the percentage of test cases that have passed, failed, or not executed status against the total number of test cases for an intent.

- In the Dialog Intent Details window, click on Covered By for any Intent Name to view the summary. For example, the Raise Complain intent is covered in a test suite with a total of Nine transitions, out of which only Eight are covered and One is missed. The total number of test cases in this intent are Eight, out of which Seven have passed and One has failed, with Zero test case not executed.
To view the intent summary and identify the issues, follow these steps:
- Click the > icon to open the intent details summary for the desired intent.
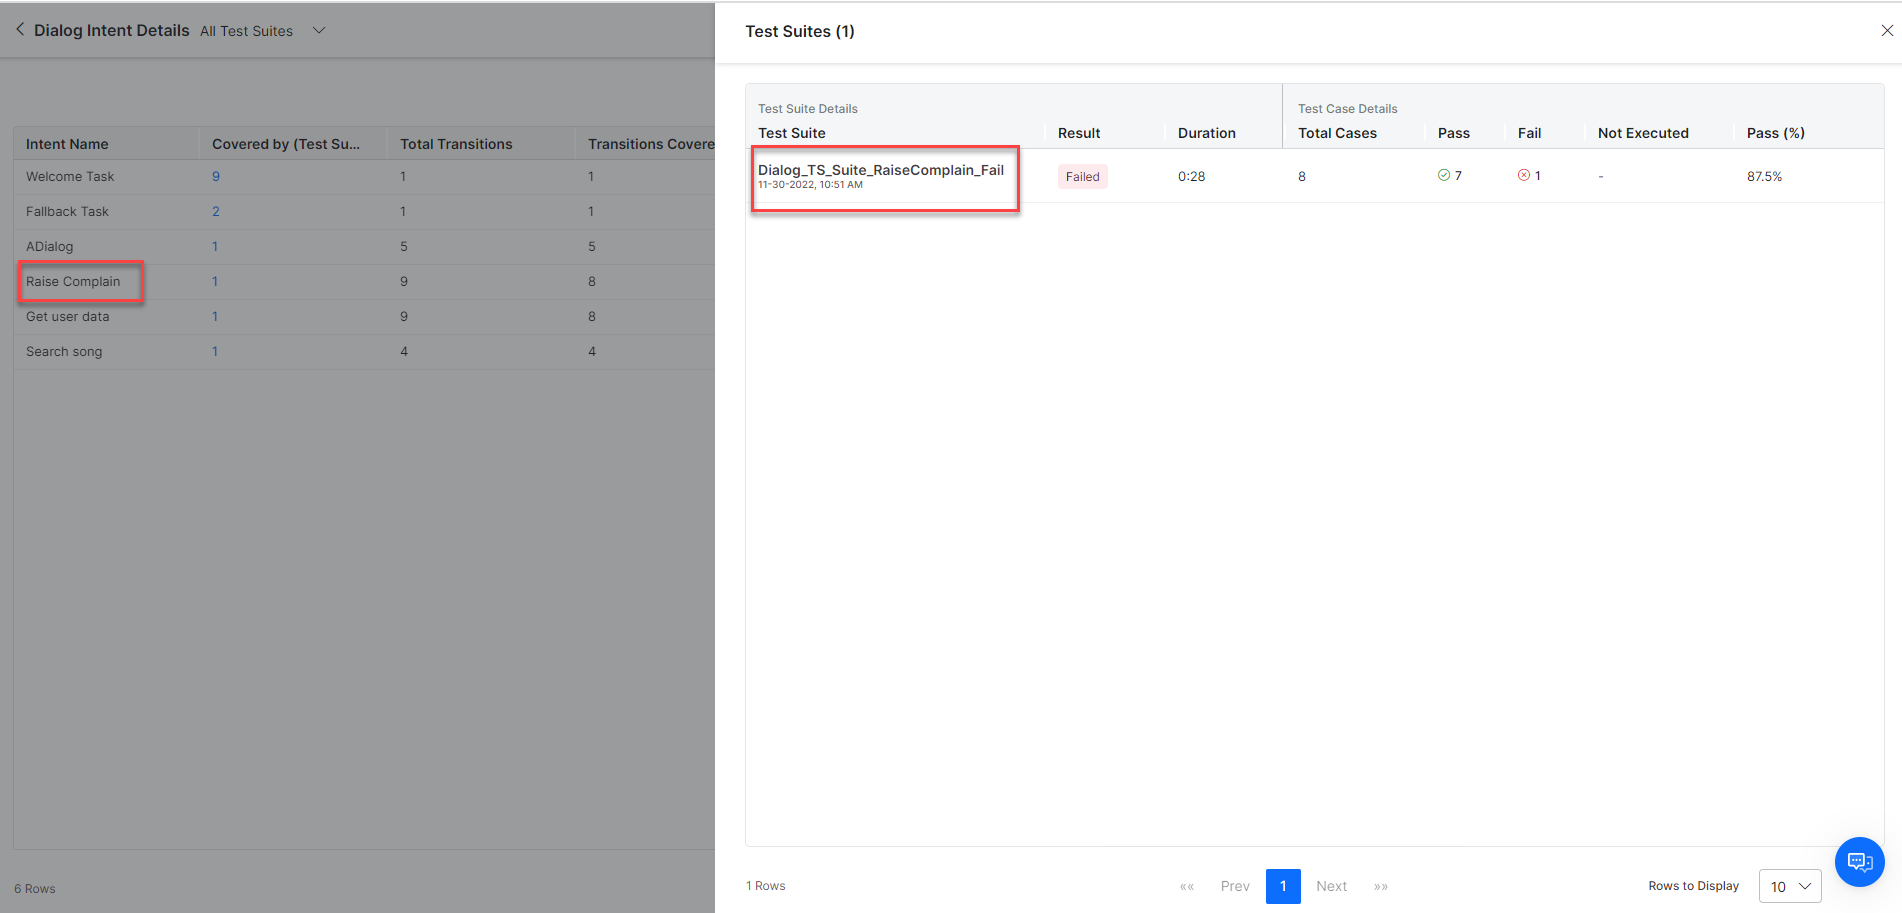
- Click the Test Suite Name to analyze how the test suite is performing. For example, click the Dialog_Test_Raise_Complain_Fail test suite to view the test results analysis as illustrated in the screenshot below:

- In this test suite, the test case1 has failed because it has an incorrect data type selected for the Date field as shown below:
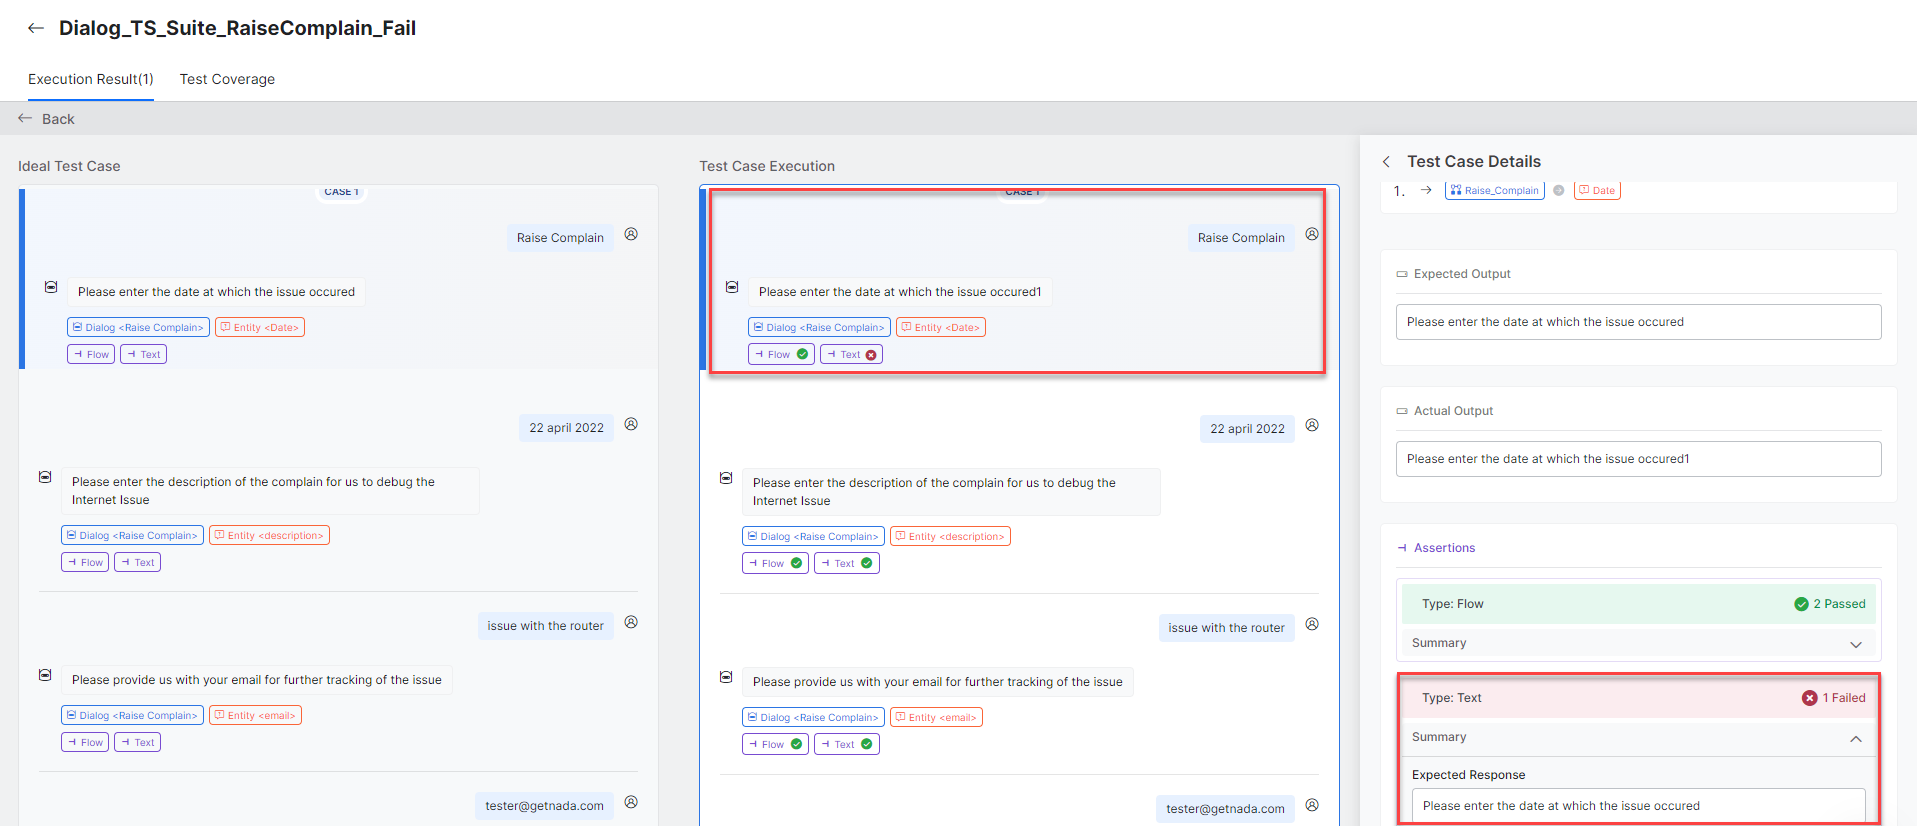
- Text assertion fails because there is a mismatch between the Expected and Actual output. For more information, see Test Case Assertion.
- Click the X icon to close the Intent Details window.
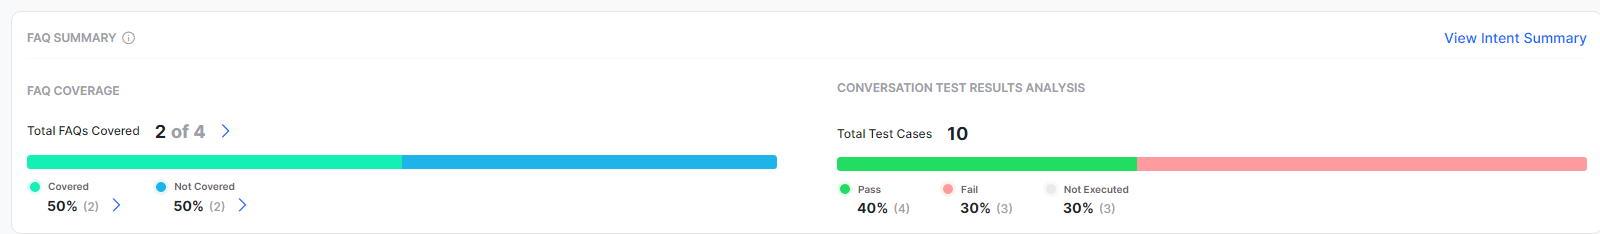
FAQs Summary
The FAQ Summary section displays the FAQ Coverage and Conversation Test Results Analysis generated for all the FAQ intents in all the test cases of the selected test suite, as discussed in the View Intent Summary section.
Click View Intent Summary to get a drill-down view of the FAQ Intents that are covered or not covered in the test suites on the FAQ Intent Details window.
FAQ Intent Details Window
This window gives the drill-down view of the FAQ-level details for the selected test suite. The primary objective here is to help users know the top-performing and low-performing FAQs to identify issues proactively and work on fixing them accordingly.

For more information, see View Intent Summary section.
- Intent Name: The name of the dialog intent.
- Path: The node path in the Knowledge Graph.
- Covered by (Test Suites): The count of the test suites in which the FAQ intents are covered.
- Total Test Cases: The count of the test cases in the selected test suites for that FAQ intent.
- Pass: The count of the passed FAQ intent test cases that passed.
- Fail: The count of the FAQ intent test cases that failed.
- Not Executed: The count of the FAQ intent test cases that are not executed.
- Pass %: The overall pass percentage of the test cases.
Small Talk
The Small Talk Summary section displays the Small Talks Coverage and Conversation Test Results Analysis generated for all the Small Talk intents in the selected test suite as discussed in the View Intent Summary section.

Small Talk Intent Details Window
Click View Intent Summary to view the Small Talk Details window that gives the drill-down view of the Small Talk level details for the selected test suite. The primary objective here is to help users know the top-performing and low-performing intents to identify issues proactively and fix them accordingly.

For more information, see View Intent Summary section.
- Intent Name: The intent name captured in the Small Talk interaction.
- Group: The group to which the Small Talk interaction is mapped.
- Covered by (Test Suites): The count of the test suites in which the Small Talk intent is covered.
- Total Test Cases: The count of the test cases present in the selected test suites for that Small Talk intent.
- Pass: The count of the Small Talk intent test cases that have passed.
- Fail: The count of the Small Talk intent test cases that failed.
- Not Executed: The count of the Small Talk intent test cases that are not executed.
- Pass %: The overall pass percentage of the test cases.