GETTING STARTED
Kore.ai XO Platform
Virtual Assistants Overview
Natural Language Processing (NLP)
Concepts and Terminology
Quick Start Guide
Accessing the Platform
Navigating the Kore.ai XO Platform
Building a Virtual Assistant
Help & Learning Resources
Release Notes
Current Major Version
Recent Updates
Previous Versions
Deprecations
Request a Feature
CONCEPTS
Design
Storyboard
Overview
FAQs
Conversation Designer
Overview
Dialog Tasks
Mock Scenes
Dialog Tasks
Overview
Navigate Dialog Tasks
Build Dialog Tasks
Node Types
Overview
Intent Node
Dialog Node
Entity Node
Form Node
Confirmation Node
Message Nodes
Logic Node
Bot Action Node
Service Node
Webhook Node
Script Node
Process Node
Agent Transfer
Node Connections
Node Connections Setup
Sub-Intent Scoping
Entity Types
Entity Rules
User Prompts or Messages
Voice Call Properties
Knowledge AI
Introduction
Knowledge Graph
Introduction
Build a Knowledge Graph
Manage FAQs
Knowledge Extraction
Import or Export Knowledge Graph
Prepare Data for Import
Importing Knowledge Graph
Exporting Knowledge Graph
Auto-Generate Knowledge Graph
Knowledge Graph Analysis
Answer from Documents
Alert Tasks
Small Talk
Digital Skills
Overview
Digital Forms
Digital Views
Introduction
Widgets
Panels
Session and Context Variables
Context Object
Intent Discovery
Train
NLP Optimization
ML Engine
Overview
Model Validation
FM Engine
KG Engine
Traits Engine
Ranking and Resolver
Training Validations
NLP Configurations
NLP Guidelines
LLM and Generative AI
Intelligence
Introduction
Event Handlers
Contextual Memory
Contextual Intents
Interruption Management
Multi-intent Detection
Amending Entities
Default Conversations
Conversation Driven Dialog Builder
Sentinment Management
Tone Analysis
Default Standard Responses
Ignore Words & Field Memory
Test & Debug
Overview
Talk to Bot
Utterance Testing
Batch Testing
Conversation Testing
Conversation Testing Overview
Create a Test Suite
Test Editor
Test Case Assertion
Test Case Execution Summary
Glossary
Health and Monitoring
NLP Health
Flow Health
Integrations
Actions
Actions Overview
Azure OpenAI
Overview
Templates
BambooHR
Overview
Templates
Freshdesk
Overview
Templates
Freshservice
Overview
Templates
HubSpot
Overview
Templates
JIRA
Overview
Templates
Microsoft Graph
Overview
Templates
Open AI
Overview
Templates
Salesforce
Overview
Templates
ServiceNow
Overview
Templates
Stripe
Overview
Templates
Twilio
Overview
Templates
Agents
Agent Transfer Overview
Custom (BotKit)
Drift
Genesys
Intercom
NiceInContact
Salesforce
ServiceNow
Unblu
External NLU Adapters
Overview
Dialogflow Engine
Test and Debug
Deploy
Channels
Publishing
Versioning
Analyze
Introduction
Dashboard Filters
Overview Dashboard
Conversations Dashboard
Users Dashboard
Performance Dashboard
Custom Dashboards
Introduction
Custom Meta Tags
Create Custom Dashboard
Create Custom Dashboard Filters
NLP Insights
Conversations History
Conversation Flows
Conversation Insights
Feedback Analytics
Usage Metrics
Containment Metrics
Universal Bots
Introduction
Universal Bot Definition
Universal Bot Creation
Training a Universal Bot
Universal Bot Customizations
Enabling Languages
Store
Manage Assistant
Plan & Usage
Overview
Usage Plans
Support Plans
Invoices
Authorization
Multilingual Virtual Assistants
Get Started
Supported Components & Features
Manage Languages
Manage Translation Services
Multiingual Virtual Assistant Behavior
Feedback Survey
Masking PII Details
Variables
Collections
IVR Settings
General Settings
Assistant Management
Manage Namespace
Data
Overview
Data Table
Table Views
App Definitions
Data as Service
HOW TOs
Build a Travel Planning Assistant
Travel Assistant Overview
Create a Travel Virtual Assistant
Design Conversation Skills
Create an ‘Update Booking’ Task
Create a Change Flight Task
Build a Knowledge Graph
Schedule a Smart Alert
Design Digital Skills
Configure Digital Forms
Configure Digital Views
Train the Assistant
Use Traits
Use Patterns
Manage Context Switching
Deploy the Assistant
Use Bot Functions
Use Content Variables
Use Global Variables
Use Web SDK
Build a Banking Assistant
Design Conversation Skills
Create a Sample Banking Assistant
Create a Transfer Funds Task
Create a Update Balance Task
Create a Knowledge Graph
Set Up a Smart Alert
Design Digital Skills
Configure Digital Forms
Configure Digital Views
Add Data to Data Tables
Update Data in Data Tables
Add Data from Digital Forms
Train the Assistant
Composite Entities
Use Traits
Use Patterns for Intents & Entities
Manage Context Switching
Deploy the Assistant
Configure an Agent Transfer
Use Assistant Functions
Use Content Variables
Use Global Variables
Intent Scoping using Group Node
Analyze the Assistant
Create a Custom Dashboard
Use Custom Meta Tags in Filters
Migrate External Bots
Google Dialogflow Bot
APIs & SDKs
API Reference
API Introduction
API List
API Collection
koreUtil Libraries
SDK Reference
SDK Introduction
SDK Security
SDK Registration
Web Socket Connect and RTM
Installing the BotKit SDK
Using the BotKit SDK
SDK Events
Tutorials
BotKit - Blue Prism
BotKit - Flight Search Sample VA
BotKit - Agent Transfer
Widget SDK Tutorial
Web SDK Tutorial
ADMINISTRATION
Introduction to Admin Console
Administration Dashboard
User Management
Add Users
Manage Groups
Manage Roles
Data Tables and Views
Assistant Management
Enrollment
Invite Users
Send Bulk Invites
Import User Data
Synchronize Users from AD
Security & Control
Using Single-Sign On (SSO)
Two-Factor Authentication (2FA)
Security Settings
Cloud Connector
Analytics
Billing
  1. Home
  2. Docs
  3. Virtual Assistants
  4. Analyzing Your Bot
  5. Users Trend Analysis

Users Trend Analysis

Once you have implemented a virtual assistant, you can gain actionable insights on the type of users it handles including unique, new, and returning users, and the user trends for a given period for different conversation types, conversation statuses, channels, languages, and custom conversational tags on the Users Dashboard.

The Users Dashboard displays the trends of total users interacting with the virtual assistant, with a breakup of new users and returning users which are helpful in understanding user trends and the user retention status of your business.

Note: The Users Dashboard is available only post 9.3 release, i.e. post-July 24, 2022.

For example, an eCommerce company requiring insights on user trend-based data for their mobile app can use the Users Dashboard to determine the following:

  • The new users, existing users, and returning users of their app.
  • The active users over a specific period.
  • The new and returning users on a specific day, week, or month.
  • The total inactive users registered on the app.
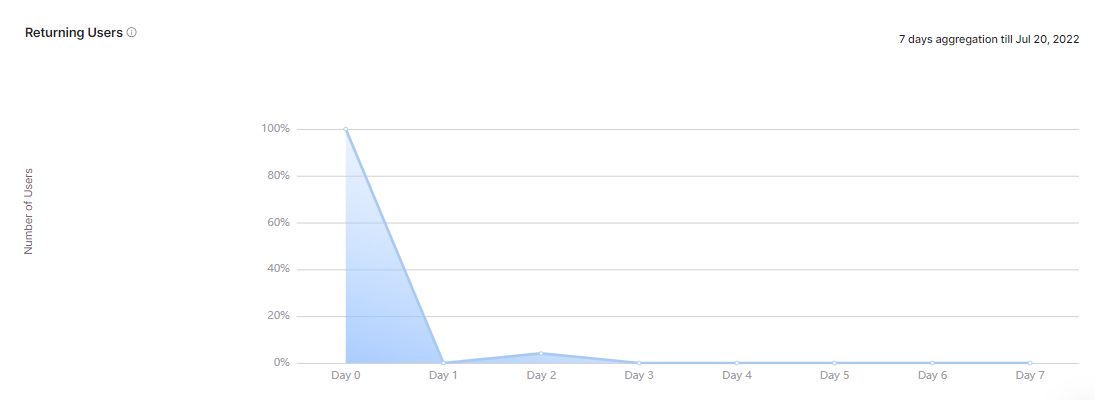
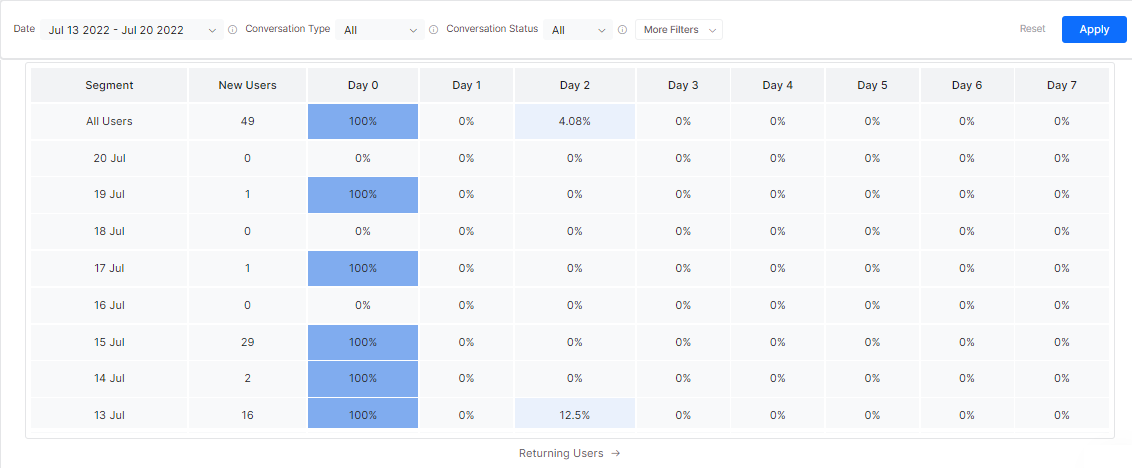
  • The percentage of users who return and use the app “N” days after they start using it.

Navigating to the Users Dashboard

To access the Users Dashboard, follow these steps:

  1. Click the Analyze tab on the top menu.
  2. Click Users Dashboard in the left navigation panel as shown below. Analyze Users Dashboard
  3. Select the relevant filter option to apply the data changes and view the data/graphs in various panels of the dashboard.

User Trends Considerations

  • If User-A has interacted with the bot on 25-Jan-2022 for the first time and the dashboard is viewed between 23-Jan-2022 to 26-Jan-2022 then this user is considered as a new user.
  • If User-B has interacted with the bot on 25-Jan-2022 for the first time and again interacted with the bot on 26-Jan-2022, and if the dashboard is viewed between 23-Jan-2022 to 26-Jan-2022, then this user is considered as:
    • A new user on 25-Jan-2022
    • A returning user on 26-Jan-2022
  • If User-C has interacted with the bot on 21-Jan-2022 for the first time and again interacted with the bot on 26-Jan-2022, and the dashboard is viewed between 23-Jan-2022 to 26-Jan-2022, then, this user is considered as a returning user.

The Users Dashboard provides insights on the following user trend metrics:

  • Total Unique Users: The total number of unique users who interacted with the virtual assistant.
  • New Users: The total number of users who have interacted with the virtual assistant for the first time in the selected period.
  • Returning Users: The total number of users who have already interacted with the virtual assistant earlier and have initiated another session in the selected period.
  • Avg. Total Unique Users Per Day: The total number of unique users who interacted with the virtual assistant in the selected period divided by the number of days in the selected period.
  • Avg. New Users Per Day: The total number of new users who interacted with the virtual assistant in the selected period divided by the number of days in the selected period.

The key components of the Users Dashboard are:

  • Users Trend: The users’ trend shows the distribution of New Users, Returning Users, and Total Unique Users who have interacted with the virtual assistant over a period. This helps determine User Engagement for the selected period.Graph- Users’ Trend for the Selected Period

  • Users Trend Summary: This panel displays the real-time counts of the Total Unique Users, New Users, Avg. Total Unique Users Per Day, and Avg. New Users Per day.

The increment/decrement of the above user metrics’ counts is displayed as percentage values.

  • Returning Users: Displays the graph for the day-wise returning users (in percentage) for the selected dates and other filters. Here, Day 0 is the first time a user interacts with the virtual assistant. The returning users % is calculated for the consecutive days for the selected period. For example, in the following image, the number of users is 100% on Day 0 (first interaction) and 0% on Day 1 since none of the users that have already interacted with the virtual assistant have initiated a conversation on the same channel/browser.Graph- Returning Users Trend for the Selected Period

  • Cohort Analysis: This data visualization chart plots the weekly new users and the percentage of returning users based on the formula (Returning Users/New Users)*100 on the consecutive days to determine the retention rate. The Users Dashboard displays the Day N retention of daily, weekly, or monthly cohorts, within a customizable range of dates. For example, if you’re looking at the retention of daily cohorts acquired from July 13 to July 20, 2022, based on the filters selected, and the actual users returning on Day 2, the following Cohort Analysis Chart is displayed:

  • Filter Criteria

    The Users Dashboard data can be viewed based on specific filter criteria that can be selected. Learn more.

    Menu