With some tasks, you may want to add a link to a message sent to a user that contains data too large for a message, for example, an message with a picture, abstract, and a link to a full article or report. This topic describes how to define a table report with variable width columns.
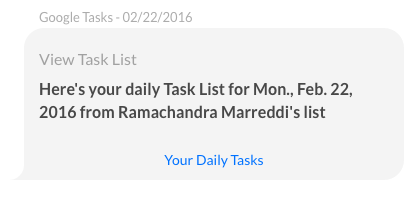
The table report type can be displayed to an end-user when the URL for this table is clicked in a message. In the following illustration, the message sent to the end-user contains a link to the table report called Your Daily Tasks. To learn how use report keys, read the Alert Tasks article.
When the user clicks the link in the message, a table report with variable width columns shows the data for the columns defined with a table header, optional table description, and a header row as shown in the following illustration for the Your list of tasks report.
To define a table report
To complete the following procedure, you must have already defined a task, such as an alert task, or information task, that you want to add a table report link to. Complete the steps in the following procedure to define a table report with variable width columns.
- In Bot Builder, select the task for the Bot that you want to add a table report link to.
Note: Only unpublished tasks can be modified.
- Click the Settings
 icon, and then click Edit.
 - On the Bot Response tab for the task that you want to add a table report to, click the Expand
 icon for the Report Template Definition section.
 - In the Link Title field, enter the link text to display to the end-user in the task post, for example, Your Task List.
- In the Header field, enter the title of the report to display when the table report is displayed to the end-user.
- In the Details field, optionally enter any end-user help information displayed directly below the Header in the report, for example, This is a list of your daily Google Tasks.
- In the Template drop-down list, select Table.
- Click Edit Template. The Table Configuration dialog is displayed.
- Click Add Column. The Column Configuration dialog is displayed as shown in the following illustration.


- In the Column Name field, enter the first column title, for example, Task.
- In the Data Type field, select one of the following data types for the information displayed in the column:
- String
- Number
- Date
- Enable Is a link if the data in the column is a hyperlink. When enabled:
- In the Link Label field, enter the JavaScript to display the text for the link, for example,
print(Name);. - In the URL Value field, enter the JavaScript to display the data to output when the Link Label is clicked, for example,
print("https://login.salesforce.com/" + Id);
- In the Link Label field, enter the JavaScript to display the text for the link, for example,
- If Is a link is not enabled, then enter the JavaScript to display the value for the column, for example,
print(StageName);. - In the Display it as an image section, select Yes if the column value is an image.
- In the Display it as HTML section, select Yes if the column value contains HTML content.
- In the Is this column Sortable section, select Yes if the end-user should be able to sort the column.
- Click Done. The Table Configuration dialog is displayed with the new column added as shown in the following illustration.

- Repeat Steps 9 – 17 for each additional column in the report, click Save to save the column configurations, and then click Close.
- In the Report Template Definition section, click Save to save the table report
The table is saved Successfully saved response data message is displayed at the top of the page.
