Once you have built your virtual assistant and trained it, the Kore.ai platform builds an ML model mapping user utterance with intents (click here for more info). Once created, it is recommended to validate the model to understand and estimate an unbiased generalization performance of the ML model.
The XO Platform offers two validation methods:
- Confusion Matrix or Error Matrix to visualize the performance of the machine learning model.
- K-fold Cross-Validation to estimate the skill of the machine learning model.
To choose the validation model, follow the below steps:
- Open the assistant that you want to validate the ML model and select Build from the top menu.
- From the left menu, click Natural Language -> Training.
- Click the Validate Model drop-down list on the top-right and select the model.
- The results page of the corresponding validation method is displayed.
In the following sections, we will look into each of these methods in detail.
K-fold Cross-Validation
Cross-Validation is a resampling procedure used to evaluate machine learning models on a limited data sample. The technique involves partitioning the data into subsets, training the data on a subset, and using the other subsets to evaluate the model’s performance. Performing Cross-Validation gives a more generalized metric on model performance which is a better indicator of the ML model’s performance.
Configuration
The XO Platform supports K-fold Cross-Validation. For this, you must configure the K-fold parameter for cross-validation from the advanced NLP configurations. Click here for more info.
To initiate the training and generate the K-fold validation report, follow the below steps:
- From the left menu under the Build top menu option, click Natural Language -> Training.
- On the Machine Learning Utterances page, click Validate Model drop-down list on the top-right and select K-fold Cross-Validation.
- On the K-fold Cross-Validation page, click Generate to initiate the training and generate the K-fold validation report. Generate button appears only when you perform the cross-validation for the first time.
- After the report is generated, you can click the Re-generate button on the top right to regenerate the report when needed.
Implementation
Following are the steps followed by the platform while performing the K-fold cross-validation:
- The entire set of utterances is randomly divided into training and test data sets.
- The entire training data is partitioned into k folds with each subset containing an equal number of training utterances. The value for k folds must be configured as mentioned above.
- The system then runs k iterations and in each iteration, a subset (fold) of utterances is tested against the model trained using the rest of the subsets (‘k – 1’ folds).
- The resulting model is validated on the test data set to compute the performance measures.
- This process is repeated until every utterance is used at least once for testing the model.
- The metrics are provided post K fold cross-validation to help you assess the ML model’s performance.
Understand the Results
The following metrics are provided post the K fold cross-validation:
- The Precision score of each testing fold – to define how precise/accurate your model is and is calculated as the ratio of true positives over total predicted positives (sum of true and false positives)
- The Recall score of each testing fold – defines the fraction of the relevant utterances that are successfully identified and is calculated as the ratio of true positives over actual positives (sum of true positives and false negatives).
- The F1 Score of each testing fold – to even out class distribution and seek a balance between precision and recall and is calculated as the weighted average of Precision and Recall.
- A mean of the precision, recall, and F1 scores for all the folds.
The following information is also provided to help understand the associated metrics better:
- Total Utterances – number of utterances in the training corpus
- Number of Intents – total number of intents in the assistant
- Number of Folds – number of subsets the training corpus was divided into the K-fold parameter
- Test Data per Fold – number of utterances in each subset used for testing
- Training Data per Fold – number of utterances in each subset used for training
Export the K-fold Cross-Validation Reports
After you have generated the K-fold Cross-Validation report, you can export the report in CSV format. To export the validation report, follow the below steps:
- On the K-fold Cross-Validation page, click the export icon on the top-right.
- On the Export Report dialog box, click Proceed.
The exported file appears in this format: Kfold_BotName_YYYYMMDDHHmmSS.csv.
Confusion Matrix
Confusion Matrix is useful in describing the performance of a classification model (or classifier) on a set of test data for which the true values are known. The graph generated by the confusion matrix presents an at-a-glance view of the performance of your trained utterances against the tasks. The name stems from the fact that it makes it easy to see if the model is confusing utterances.
The ML Model graph evaluates all the training utterances against each task and plots them into one of these quadrants of the task: True Positive (True +ve), True Negative (True -ve), False Positive (False +ve), False Negative (False -ve). A quick look at the graph and you know which utterance-intent matches are accurate and which can be further trained to produce better results.
The higher the utterance in the True quadrants the better it exhibits expected behavior. True +ve represents a strong match with the task for which they are trained and the True -ve represents a mismatch with the irrelevant intents as expected. Utterances at a moderate level in the True quadrants can be further trained for better scores.
The utterances falling into the False quadrants need immediate attention. These are the utterances that are either not matching with the intended tasks or are matching with the wrong ones. To read the utterance text in any quadrant, hover over the dot in the graph.

True Positive Quadrant
When utterances trained for an intent receive a positive confidence score for that intent, they fall into its True Positive quadrant. This quadrant represents a favorable outcome. However, the higher the utterance on the quadrant’s scale the more chances of it finding the right intent.
True Negative Quadrant
When utterances not trained for an intent to receive a negative confidence score for the intent, they fall into its True Negative quadrant. This quadrant represents a favorable outcome as the utterance is not supposed to match with the intent. The lower the utterance on the quadrant’s scale, the higher the chances of it staying afar from the intent. All the utterances trained for a particular task should ideally fall into the True Negative quadrants of the other tasks.
False Positive Quadrant
When utterances that are not trained for an intent receive a positive confidence score for the intent, they fall into its False Positive quadrant. This quadrant represents an unfavorable outcome. For such outcomes, the utterance, the intended task, and the incorrectly matching task may have to be trained for optimum results.
False Negative Quadrant
When utterances trained for an intent receive a negative confidence score for the intent, they fall into its False Negative quadrant. The quadrant represents an unfavorable outcome as the utterance is supposed to match with the intent. For such outcomes, the utterance, the intended task, and the task need to be trained for optimum outcome. Read Machine Learning to learn more.
Note: Make sure to click the train button after making any changes to your assistant to reflect them in the ML Model Graph.
Consider the following key points when referring to the graph:
- The higher up the utterance in the True quadrants the better it exhibits the expected behavior.
- Utterances at a moderate level in the True quadrants can be further trained for better scores.
- The utterances falling into the False quadrants need immediate attention.
- Utterances that fall into the True quadrants of multiple tasks denote overlapping tasks that must be fixed.
Understand a Good/Bad ML model
Let us consider a travel assistant as an example to understand good or bad ML Mode. The assistant has multiple tasks with more than 300 trained utterances. The below image depicts 4 tasks and the associated utterances.
The model in this scenario is fairly well trained with most of the utterances pertaining to a task are concentrated in the True Positive quadrant and most of the utterances for other tasks are in the True Negative quadrant.
The developer can work to improve on the following aspects of this model:
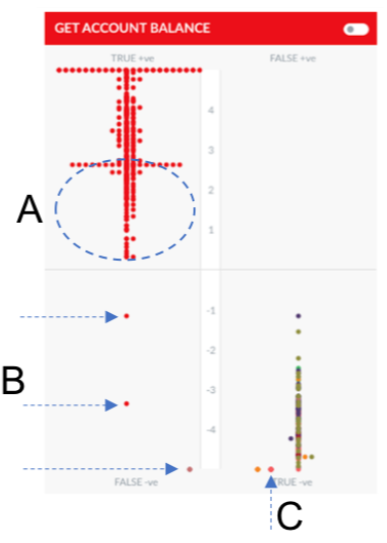
- In the ML model for task ‘Get Account Balance’ we can see a few utterances (B) in the False Positive quadrant.
- An utterance trained for Get Account Balance appears in the True Negative quadrant (C).
- Though the model is well trained and most of the utterances for this task are higher up in the True Positive quadrant, some of the utterances still have a very low score. (A)
- When you hover over the dots, you can see the utterance. For A, B, and C, though the utterance should have exactly matched the intent, it has a low or negative score as a similar utterance has been trained for another intent.
Note: In such cases, it is best to try the utterance with Test & Train module, check for the intents that the ML engine returns and the associated sample utterances. Fine-tune the utterances and try again.
- The task named Report Loss of Card contains limited utterances that are concentrated together.
Let us now compare it with the ML Model for the Travel Assistant below:
The model is trained with a lot of conflicting utterances, resulting in a scattered view of utterances. This will be considered as a bad model and must be re-trained with a smaller set of utterances that do not relate to multiple tasks in a VA.
View the Graph for Specific Task Utterances
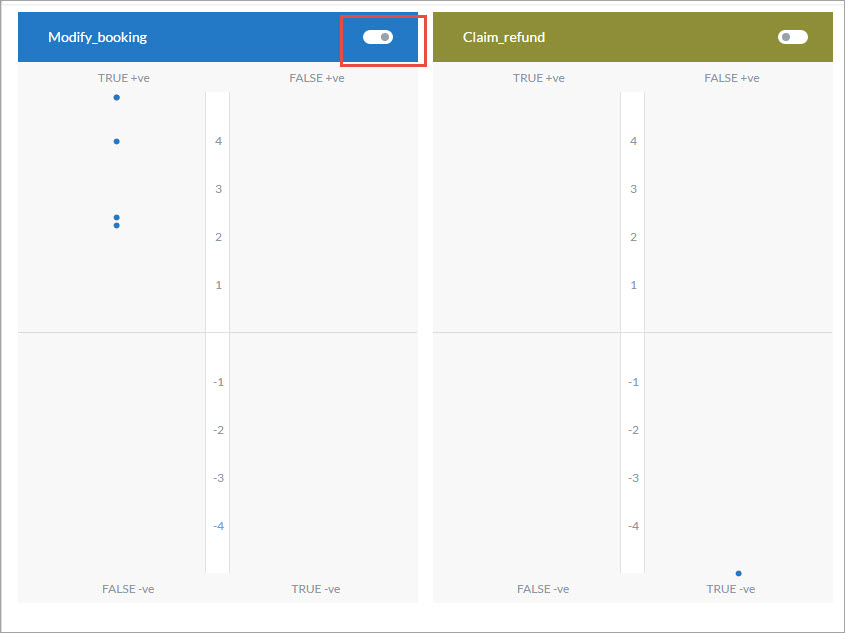
By default, the ML Model Graph shows the performance of all the trained utterances against all tasks. To view the performance of a specific task’s trained utterances against all the other intents, toggle the switch for the task as shown in the image below.

Since these are the trained utterances of the first task, ideally the utterances should appear at the top of the True +ve quadrant of that task and the bottom of the True -ve quadrant of all the other tasks.
Filter the ML Model Graph
You can filter the ML Model Graph based on the following criteria:

- In Development or Published: By default the graph shows the graph for all the tasks In Development and Published tasks. Toggle the switch to view the graph for only the published tasks.
- Weak to Strong: View the graph from the least accurate task scores to the most accurate.
- Strong to Weak: View the graph from the most accurate task scores to the least.
- Task/Intent: Select all or select specific task names to view their graph.
- Utterance: Select all or select specific trained utterances to view their graph.
Edit and Reassign Utterances
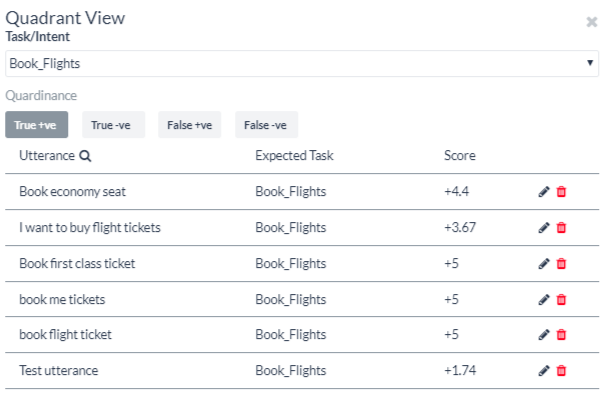
You can edit user utterances and re-assign them to other tasks to improve their scores directly from the ML graph. To do this, click on a quadrant and the Quadrant view opens with the name of the task and all the utterances related to it.
To edit an individual utterance,
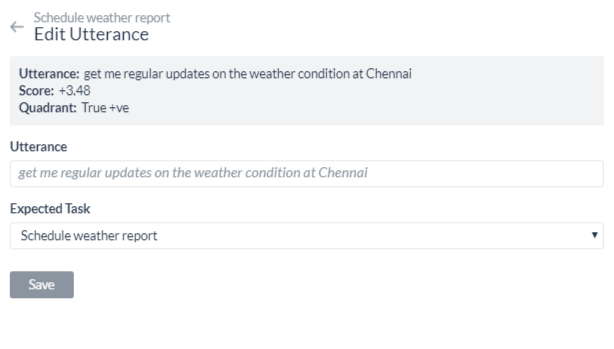
- Click the edit icon on the respective utterance row.
- On the Edit Utterance window, make changes to the text in the Utterance field or reassign the utterance to another task using the Expected Task drop-down list.
To understand NLU Training Validations and NLU Validate model, see Training Validations.
Whenever the Validate model is updated, you can click the Re-Run Model to generate the latest matrix. To know more, see NLU Validation Options.


