GETTING STARTED
Kore.ai XO Platform
Virtual Assistants Overview
Natural Language Processing (NLP)
Concepts and Terminology
Quick Start Guide
Accessing the Platform
Navigating the Kore.ai XO Platform
Building a Virtual Assistant
Help & Learning Resources
Release Notes
Current Version
Recent Updates
Previous Versions
Deprecations
Request a Feature
CONCEPTS
Design
Storyboard
Overview
FAQs
Conversation Designer
Overview
Dialog Tasks
Mock Scenes
Dialog Tasks
Overview
Navigate Dialog Tasks
Build Dialog Tasks
Node Types
Overview
Intent Node
Dialog Node
Dynamic Intent Node
GenAI Node
GenAI Prompt
Entity Node
Form Node
Confirmation Node
Message Nodes
Logic Node
Bot Action Node
Service Node
Webhook Node
Script Node
Process Node
Agent Transfer
Node Connections
Node Connections Setup
Sub-Intent Scoping
Entity Types
Entity Rules
User Prompts or Messages
Voice Call Properties
Knowledge AI
Introduction
Knowledge Graph
Introduction
Terminology
Build a Knowledge Graph
Manage FAQs
Knowledge Extraction
Import or Export Knowledge Graph
Prepare Data for Import
Importing Knowledge Graph
Exporting Knowledge Graph
Auto-Generate Knowledge Graph
Knowledge Graph Analysis
Answer from Documents
Alert Tasks
Small Talk
Digital Skills
Overview
Digital Forms
Digital Views
Introduction
Widgets
Panels
Session and Context Variables
Context Object
Intent Discovery
Train
NLP Optimization
ML Engine
Overview
Model Validation
FM Engine
KG Engine
Traits Engine
Ranking and Resolver
Training Validations
NLP Configurations
NLP Guidelines
LLM and Generative AI
Introduction
LLM Integration
Kore.ai XO GPT Module
Prompts & Requests Library
Co-Pilot Features
Dynamic Conversations Features
Intelligence
Introduction
Event Handlers
Contextual Memory
Contextual Intents
Interruption Management
Multi-intent Detection
Amending Entities
Default Conversations
Conversation Driven Dialog Builder
Sentinment Management
Tone Analysis
Default Standard Responses
Ignore Words & Field Memory
Test & Debug
Overview
Talk to Bot
Utterance Testing
Batch Testing
Conversation Testing
Conversation Testing Overview
Create a Test Suite
Test Editor
Test Case Assertion
Test Case Execution Summary
Glossary
Health and Monitoring
NLP Health
Flow Health
Integrations
Actions
Actions Overview
Asana
Configure
Templates
Azure OpenAI
Configure
Templates
BambooHR
Configure
Templates
Bitly
Configure
Templates
Confluence
Configure
Templates
DHL
Configure
Templates
Freshdesk
Configure
Templates
Freshservice
Configure
Templates
Google Maps
Configure
Templates
Here
Configure
Templates
HubSpot
Configure
Templates
JIRA
Configure
Templates
Microsoft Graph
Configure
Templates
Open AI
Configure
Templates
Salesforce
Configure
Templates
ServiceNow
Configure
Templates
Stripe
Configure
Templates
Shopify
Configure
Templates
Twilio
Configure
Templates
Zendesk
Configure
Templates
Agents
Agent Transfer Overview
Custom (BotKit)
Drift
Genesys
Intercom
NiceInContact
NiceInContact(User Hub)
Salesforce
ServiceNow
Configure Tokyo and Lower versions
Configure Utah and Higher versions
Unblu
External NLU Adapters
Overview
Dialogflow Engine
Test and Debug
Deploy
Channels
Publishing
Versioning
Analyze
Introduction
Dashboard Filters
Overview Dashboard
Conversations Dashboard
Users Dashboard
Performance Dashboard
Custom Dashboards
Introduction
Custom Meta Tags
Create Custom Dashboard
Create Custom Dashboard Filters
LLM and Generative AI Logs
NLP Insights
Task Execution Logs
Conversations History
Conversation Flows
Conversation Insights
Feedback Analytics
Usage Metrics
Containment Metrics
Universal Bots
Introduction
Universal Bot Definition
Universal Bot Creation
Training a Universal Bot
Universal Bot Customizations
Enabling Languages
Store
Manage Assistant
Team Collaboration
Plan & Usage
Overview
Usage Plans
Templates
Support Plans
Invoices
Authorization
Conversation Sessions
Multilingual Virtual Assistants
Get Started
Supported Components & Features
Manage Languages
Manage Translation Services
Multiingual Virtual Assistant Behavior
Feedback Survey
Masking PII Details
Variables
Collections
IVR Settings
General Settings
Assistant Management
Manage Namespace
Data
Overview
Data Table
Table Views
App Definitions
Data as Service
HOW TOs
Build a Travel Planning Assistant
Travel Assistant Overview
Create a Travel Virtual Assistant
Design Conversation Skills
Create an ‘Update Booking’ Task
Create a Change Flight Task
Build a Knowledge Graph
Schedule a Smart Alert
Design Digital Skills
Configure Digital Forms
Configure Digital Views
Train the Assistant
Use Traits
Use Patterns
Manage Context Switching
Deploy the Assistant
Use Bot Functions
Use Content Variables
Use Global Variables
Use Web SDK
Build a Banking Assistant
Design Conversation Skills
Create a Sample Banking Assistant
Create a Transfer Funds Task
Create a Update Balance Task
Create a Knowledge Graph
Set Up a Smart Alert
Design Digital Skills
Configure Digital Forms
Configure Digital Views
Add Data to Data Tables
Update Data in Data Tables
Add Data from Digital Forms
Train the Assistant
Composite Entities
Use Traits
Use Patterns for Intents & Entities
Manage Context Switching
Deploy the Assistant
Configure an Agent Transfer
Use Assistant Functions
Use Content Variables
Use Global Variables
Intent Scoping using Group Node
Analyze the Assistant
Create a Custom Dashboard
Use Custom Meta Tags in Filters
Migrate External Bots
Google Dialogflow Bot
APIs & SDKs
API Reference
API Introduction
Rate Limits
API List
koreUtil Libraries
SDK Reference
SDK Introduction
Web SDK
How the Web SDK Works
SDK Security
SDK Registration
Web Socket Connect and RTM
Tutorials
Widget SDK Tutorial
Web SDK Tutorial
BotKit SDK
BotKit SDK Deployment Guide
Installing the BotKit SDK
Using the BotKit SDK
SDK Events
SDK Functions
Tutorials
BotKit - Blue Prism
BotKit - Flight Search Sample VA
BotKit - Agent Transfer
  1. Home
  2. Docs
  3. Virtual Assistants
  4. How Tos
  5. Create Custom Dashboard

Create Custom Dashboard

Let’s create a dashboard using various metrics to analyze the performance of a Virtual Assistant and identify trends for business needs using a Banking Bot as an example.

Problem Statement

As a Banking Bot client, you want to track the following metrics:

You can create a custom dashboard to achieve all the scenarios listed above, with detailed step-by-step instructions as described in the following sections.

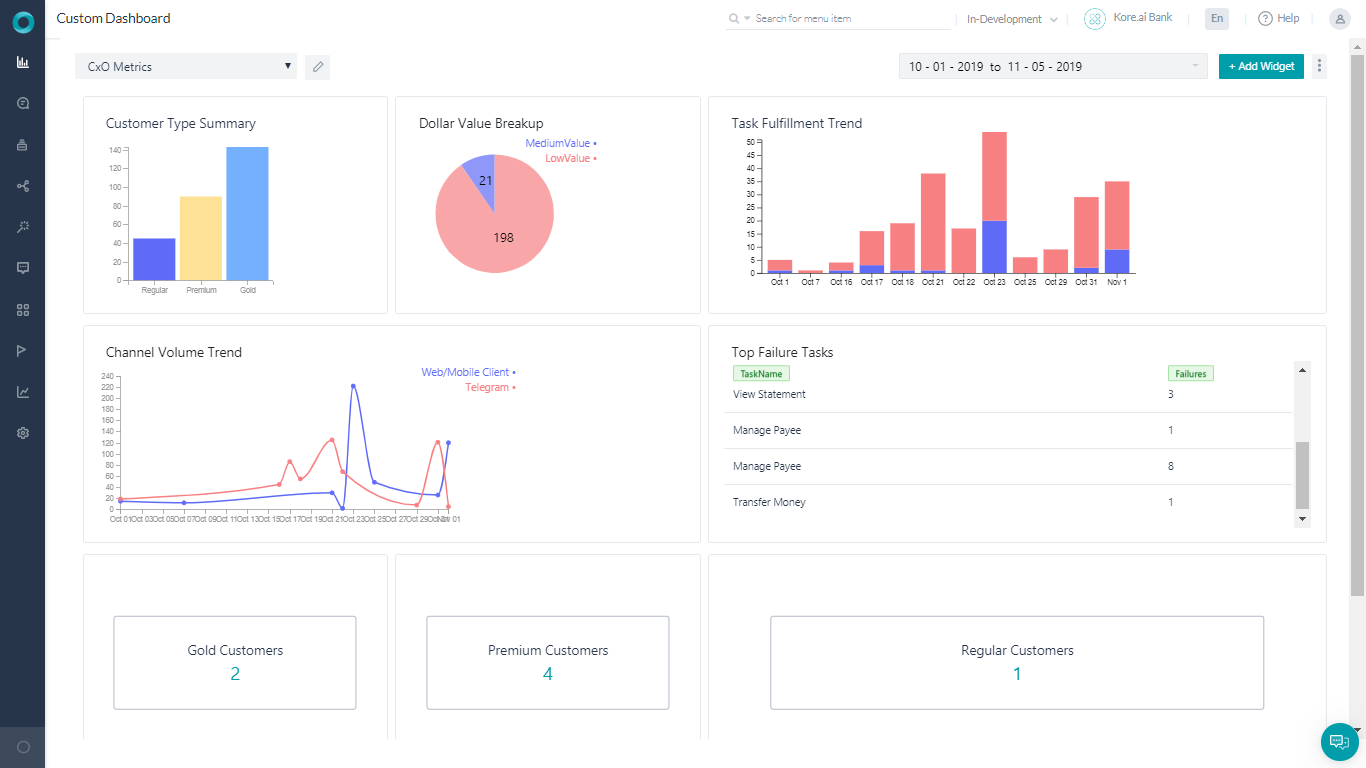
Once the Dashboard is configured for the listed scenarios, it looks like below.

Pre-requisites

  • Bot building knowledge.
  • Custom Meta Tags usage. See here for more information.
  • A Banking Bot with the dialogs as follows:
    • Transfer Funds – The Dialog task walking the user through the steps in transferring money.
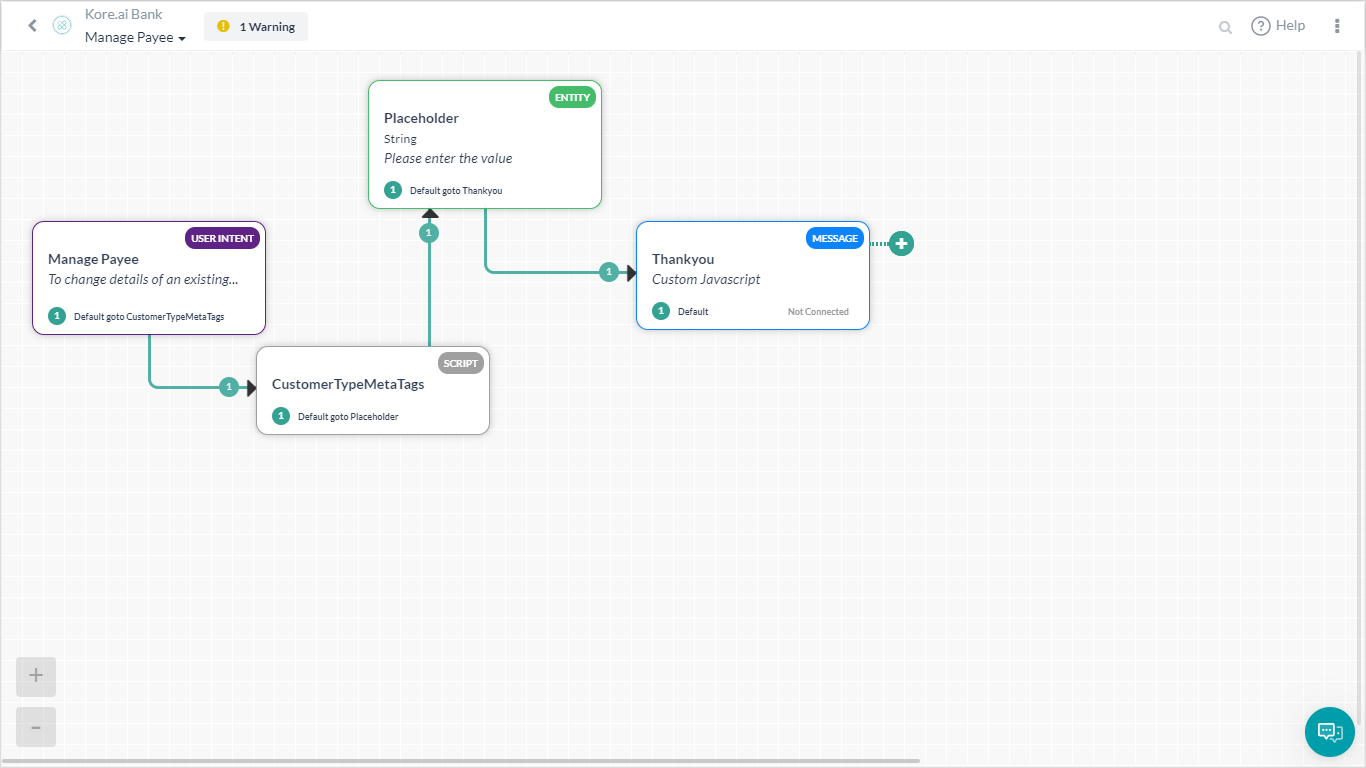
      In this diaog, we have included a Script node to add Custom Meta Tag, TransferValue, based upon the amount transferred. The following script is used:

      if(context.entities.TransferAmount[0].amount > 50000){
         tags.addSessionLevelTag("TransferValue","HighValue");
      }
      
      if(context.entities.TransferAmount[0].amount > 10000)
      tags.addSessionLevelTag("TransferValue","MediumValue");
      
      if(context.entities.TransferAmount[0].amount > 0)
      tags.addSessionLevelTag("TransferValue","LowValue");

    • Manage Payee – For the user to manage their payee list.Here we have a Script that assigns a value to the customerType meta tags:
      if(context.custType == 3){
         tags.addUserLevelTag("CustomerType","Premium");
      }
      if(context.custType == 2){
         tags.addUserLevelTag("CustomerType","Gold");
      };
      if(context.custType == 1){
         tags.addUserLevelTag("CustomerType","Regular");
      };

Implementation

Let’s consider how each metric mentioned in the problem statement can be implemented using widgets from the Custom Dashboard.

    1. From the left navigation panel, under Dashboard click Custom Dashboard.
    2. Create New Dashboard.
    3.  Use the Add Widget button to add widgets for the above scenarios. You can add up to 4 widgets per row and organize them by moving anywhere within the row or across the rows on the dashboard. You can also manually resize the widgets.

The details for each widget are explained in the following sections.

Dollar Value Breakup

  1. Add Widget
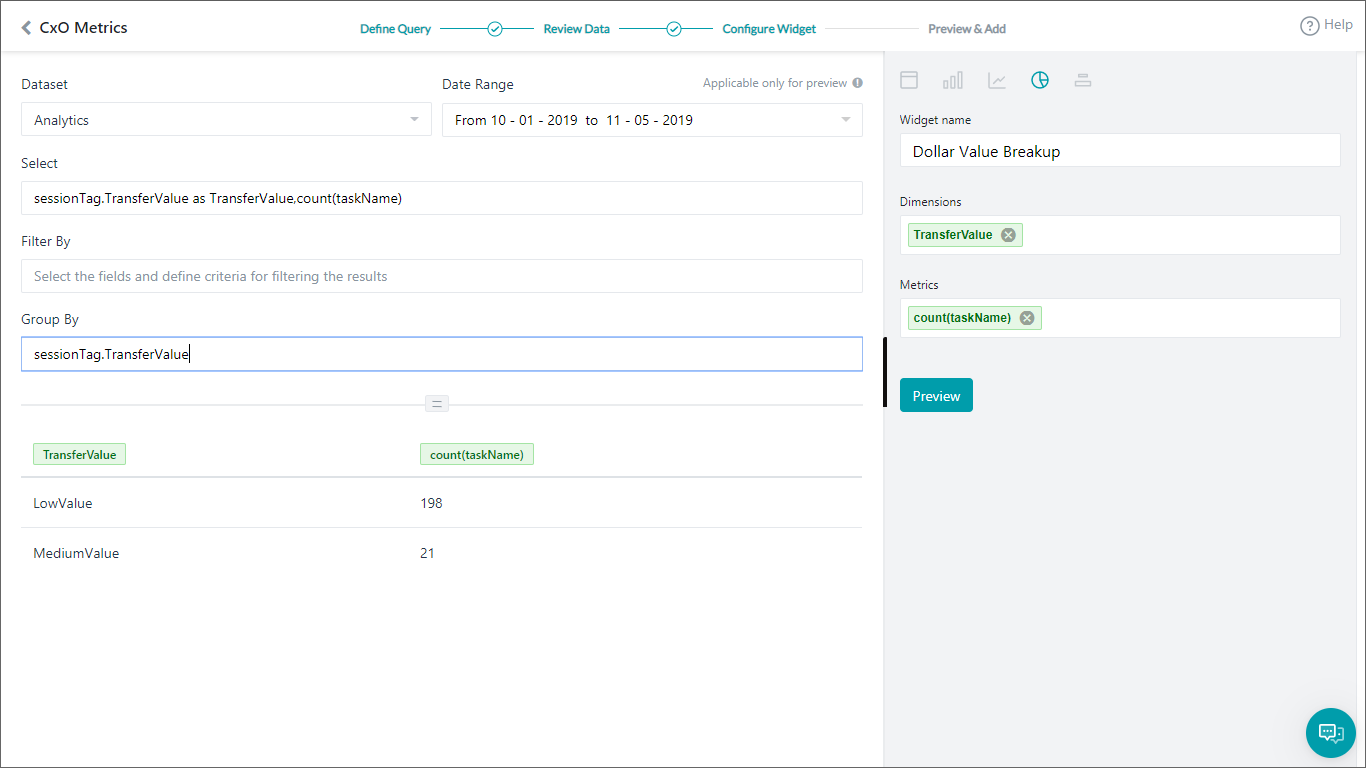
  2. Query setup:
    • DatasetAnalytics
    • SelectsessionTag.TransferValue as TransferValue,count(taskName)
      This will let the platform know what data to fetch. Here we are using the session tag values added to the Transfer Amount task against the total number of tasks executed.
    • Group BysessionTag.TransferValue
    • Run to see the results from the above query.
  3. Widget Setup
    1. Select Pie chart
    2. Set Dimension to TransferValue
    3. Set Metrics to count(taskName)

  4. See the Preview and if all is fine, click Update to Dashboard

Customer Type Summary

This query provides usage statistics based on the customer type.

Repeat the steps listed in the previous section (Dollar Value Breakup) with the following details:

  1. Add Widget
  2. Query setup:
    • DatasetAnalytics
    • SelectuserTag.CustomerType as CustomerCategory, count(taskName)
    • Group ByuserTag.CustomerType
    • Run to see the results from the above query.
  3. Widget Setup
    1. Select Bar chart
    2. Set Dimension to CustomerCategory
    3. Set Metrics to count(taskName)

  4. See the Preview and then click Update to Dashboard

Task Fulfillment Trend

This query provides day-wise task success vs. failure trends.

Repeat the steps listed in the previous section with the following details:

  1. Add Widget
  2. Query setup:
    • DatasetAnalytics
    • Selectdate,metricType, count(metricType) as TotalTasks
    • Filter BymetricType = ‘successtasks’ or metricType = ‘failedtasks’
      We want to see only Success or Failed Tasks
    • Group Bydate,metricType
    • Run to see the results from the above query.
  3. Widget Setup
    1. Select Bar chart
    2. Set Dimension to date
    3. Set Metrics to TotalTasks
    4. Set Overlay to metricType

  4. See the Preview and then click Update to Dashboard.

Top Failure Tasks

This query provides top tasks that are failing.

Repeat the steps listed in the previous section with the following details:

  1. Add Widget
  2. Query setup:
    • DatasetAnalytics
    • SelecttaskName as TaskName,count(taskName) as Failures
    • Filter BymetricType = ‘failedtasks’
      We want to see only Failed Tasks
    • Group BytaskName
    • Run to see the results from the above query.
  3. Widget Setup
    1. Select Table chart
    2. Set Dimension to TaskName and Failures

  4. See the Preview and then click Update to Dashboard

Channel Volume Trend

This query provides channel-wise usage details.

Repeat the steps listed in the previous section with the following details:

  1. Add Widget
  2. Query setup:
    • DatasetMessages
    • Selectdate,channel,count(messageId)
    • Group Bydate,channel
    • Run to see the results from the above query.
  3. Widget Setup
    1. Select Line chart
    2. Set Dimension to date
    3. Set Metrics to count(messageId)
    4. Set Overlay to channel

  4. See the Preview and then click Update to Dashboard

You Custom Dashboard is ready. Set the Date Range to see the required metrics for the scenarios.

Filter the Messages using the Having Clause

This query uses a Having clause, to display the number of filtered messages for userIds, where the user has interacted with the virtual assistant more than 12 times. The query setup and result are described below.

Repeat the steps listed in the previous section with the following details:

  1. Add Widget
  2. Query setup:
    • DatasetMessages
    • Selectcount(messageId),userId
    • Group ByuserId
    • Having – count(messageId) > 12
    • Run to see the results from the above query.
  3. Widget Setup
    • Select Table chart
    • Set Dimension to count(messageId),userId
  4. The following is a result when you just retrieve the count of all messages, grouping by the userId.
  5. The following is a result when you retrieve the count of messages, grouping by the userId, using the Having clause.
  6. See the Preview and then click Add to Dashboard.

    The Having clause widget is added to the dashboard as shown in the following screenshot.
Menu