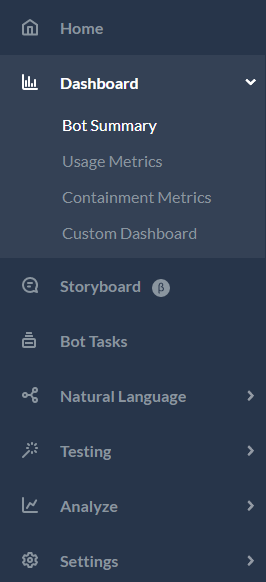
Kore.ai Bots Platform allows you to get real-time metrics and conversation flows from its Dashboard. Following are the sections in this option:
- Bot Summary to get a bird’s eye view of all the bot configuration and capabilities in a place. See here for details.
- From the Usage Metrics section view real-time and standard dashboards on your bot’s performance. See here for details.
- The Containment Metrics section provides insights into how effectively customers are engaging with the bot vs transferring to agents or dropping offs. . See here for details.
- The Custom Dashboard allows you to design your own reports and dashboards. See here for details.
Bot Summary
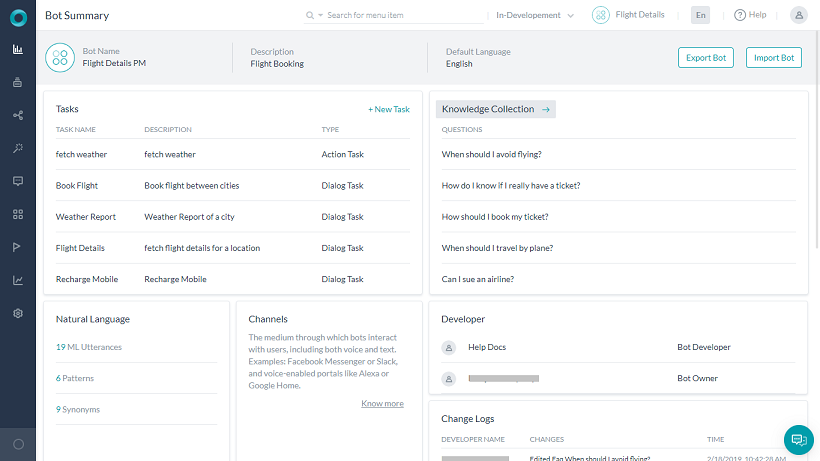
This page gives a detailed summary of the Bot configuration. This includes various snippets of bot definition as widgets. Clicking on any of these widgets takes you to the corresponding module.
These snippets give an overview of the:
- Tasks added (list of Linked Bots in case of a Universal Bot),
- Knowledge Graph configured,
- Natural Language – patterns, utterances, and synonyms,
- Change Logs – visible only to the owner of the bot;
- Developers working on the Bot – visible only to the owner of the bot;
- Authorization Profile,
- Events,
- Bot Variables, and
- any other settings configured for this Bot.
You can use this page to Import Bot and Export Bot and add New Tasks too.
Realtime Status
The first section on the Usage Metrics page is Real-time Status. This gives an overview of your Bot usage at a given point in time. It is set to refresh every 30 secs, which can be customized using the dropdown next to the Refresh button.
Post ver8.0 release of the platform, you can configure to proactively close sessions, see here for more. This will help you in weeding out the sessions by anonymous users when the virtual assistant is hosted on a website or one-time users from channels like Facebook, etc.. Note that if you fail to configure this, the real-time metrics might not give an accurate view.
The Realtime Status includes:
- Active Users – number of users interacting with the Bot.
- Active Channels – clicking on the card expands the list of active channels along with the number of users using the same.
- Active Agent Sessions – sessions that are in progress at a given instance.
Usage Metrics
From the Dashboard on the left navigation menu, you can access the Usage Metrics page. This page is your one-stop bot activity and bot user overview.
Note post ver8.0, interactive and non-interactive sessions are included in the usage metrics. See here for more details on sessions.
Usage metrics give an idea regarding the bot performance in terms of the frequency of user interaction, channels of interaction, tasks performed, etc.
- Chat Session Records: By default, Bot usage metrics based on usage of the bot during the past 24 hours is displayed. You can customize the metrics displayed by the time period and bot selection. Filter criteria can also be applied, see below for details.
- An overview of the number of Tasks being completed, number of Conversation Sessions, and the number of Alerts Sent are displayed.
- A graphic illustration of the Messages and Conversation Sessions. This includes
- Messages – the number of messages exchanged between the user and Bot;
- Conversation Sessions – the number of conversation sessions initiated with the bot ie the exchange between user and Bot without change of intent even after a specified idle time See here for details on the sessions definition.
- Details of:
- the number of Successful Tasks in the selected period of time;
- the pie chart comparing Intent Recognition vs Failed Tasks;
- Name and Count of successful tasks executions;
- Channels of interaction with the number of messages exchanged;
- Number sessions in Agent Transfer.
Containment Metrics
(introduced in ver8.0)
Notes:
- Containment metrics are available post ver8.0 release of the platorm and for conversation sessions created after that upgrade.
- Containment metrics are generated only for conversations in a closed state, see here for more on conversation session durations.
Containment Metrics provides insights on whether the conversation sessions were successfully answered by the virtual assistant or if they were handed off to agents or user dropped off. The metrics are categorized into:
- Self-service Conversations – These include sessions where a user has completed an interaction successfully. This will include all the sessions that are neither ‘agent transfer’ sessions nor ‘drop-off’ sessions;

- Drop-offs – These include sessions where the user exits the chat session abruptly. This will include all the sessions where the session has ended in any of the following scenarios:
- The user was in the middle of a task execution;
- The last task ended as a Task Failure;
- The last interaction/message resulted in an ‘intent not identified’ scenario;
- Non-interactive sessions;
- No response from the bot.
- Agent Transfer Conversations – These include sessions where the user is transferred to an agent using the Agent Transfer node at any point in the session.

Each category gives a bird’s eye view of:
- The number of conversation sessions that have started in the selected time period;
- The percentage increase or decrease when compared to the previous time period.
The following table gives the details of the metrics displayed.
| Widget | Description | Self Service | Agent Transfer | Drop Offs |
|---|---|---|---|---|
| Totals | Percentage of conversation sessions in the selected time period – hourly if 24hr period is selected, daily for other intervals. | Self Service Conversations | Conversations that were transferred to an agent. | Conversations where the user dropped off. |
| Insights |
Percentage of conversations against buckets of:
The range for the duration, number of messages, and tasks can be set as per your need. |
Record of all self-service conversations within the session. | Record of all conversations within the session before Agent Transfer. | Record of all conversations within the session before Drop Off. |
| Conversation Flows |
The sequence of tasks and the count For each flow, execution of the flow along with relevant details is displayed with the entire transcript displayed when clicked upon. |
Top conversation flows that were successfully completed i.e. in Self-Service conversations. | Top conversation flows that were handed off to an Agent | Top conversation flows that resulted in user drop off. |
| Tasks |
Name of the task and the count. For each task, additional information like User Name, Failure Point, Failure Reason, Date & Time, and Channel would be given with the entire transcript displayed when clicked upon. |
N/A | The total number of failed tasks. | The total number of failed tasks. |
| Intents |
The cluster of similar intents/utterances and the count. For each utterance, additional information like User Name, Utterance, Date & Time, and Channel would be given with the entire transcript displayed when clicked upon. |
N/A | The total number of times that this utterance was unidentified. | The total number of times that this utterance was unidentified. |
Filter Criteria
A filter can be applied to display the required Metrics.
- Select the Time Period:
- 7 Days – Data aggregated over the past seven days is displayed.
- 24 Hours – Only data aggregated during the immediately preceding 24 hours is displayed. This is the default setting.
- Custom – Click to display the Custom Date Range dialog that you can use to define a specific date period. On the left side, select or enter a start date, and then on the right side, select or enter the end data for displaying activity data. Selection up to a maximum of 90 days preceding the current date is allowed.
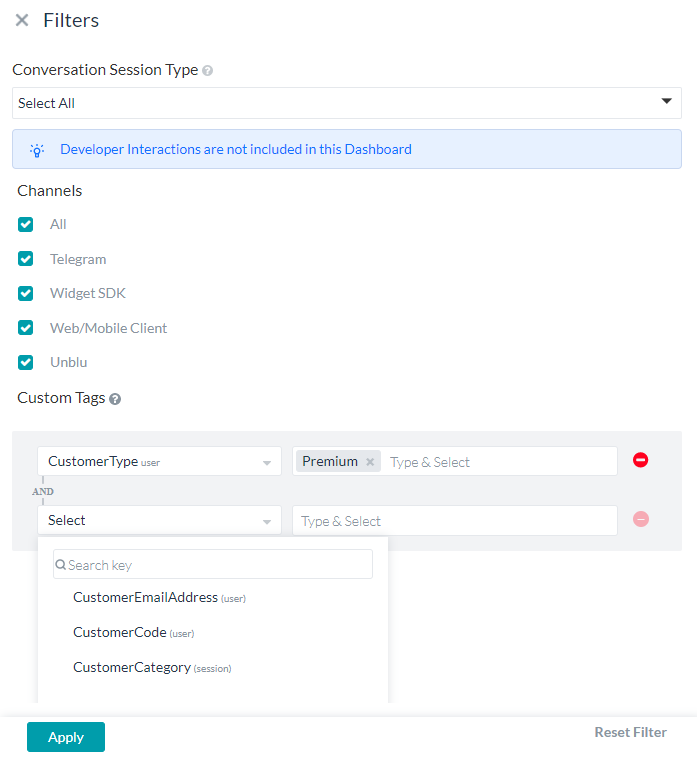
- Using the Filter option, select:
- The conversation session types can be either one or both (default setting) of the following:
- interactive – the normal conversation between the user and the bot;
- non-interactive – sessions where bot messages are presented to the user without any message from the user
(introduced in ver 8.0) see here for details on conversation session types.
- over a specified Channel.
- based upon the meta tags added at a message, user, or session levels. Multiple tags can be selected wherein the ‘AND’ condition is applied.
- The conversation session types can be either one or both (default setting) of the following:
Tag-based
Post ver7.1 release of the platform, you can filter the dashboard using meta tags added at a message, user, or session levels. Multiple tags can be selected under the filter criteria, an ‘and‘ condition will be applied across multiple fields selected for filtering.
The following table gives the widget-wise applicability of meta tags on the dashboard.
| Widget Type | Session Tags | User Tags | Message Tags |
| Realtime Widgets | Not Applicable | Not Applicable | Not Applicable |
| Usage Metrics Widgets | |||
| Successful Tasks | Applicable | Applicable | Not Applicable |
| Alerts Sent | Applicable | Applicable | Not Applicable |
| Sessions | Applicable | Applicable | Not Applicable |
| Messages & Conversation Sessions | Applicable | Applicable | Applicable for Chats |
| Successful Tasks | Applicable | Applicable | Not Applicable |
| Intent Recognized vs. Failed | Applicable | Applicable | Not Applicable |
| Top Tasks | Applicable | Applicable | Not Applicable |
| Top Channels | Applicable | Applicable | Not Applicable |
| Agent Transfer | Applicable | Applicable | Not Applicable |
| Containment Metrics Widgets | Applicable | Applicable | Applicable |


