After you have defined your bot and configured one or more tasks, you should test your settings before you publish your NLP-enabled bot. Bot owners and developers can chat with the bot in real-time to test recognition, performance, and flow as if it were a live session.
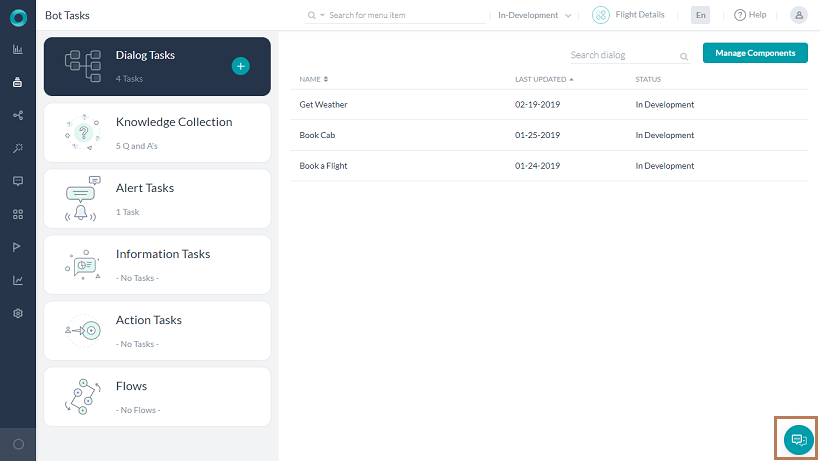
To test your tasks in a messaging window, click the Talk to Bot ![]() icon located on the lower right corner on the Bot Builder.
icon located on the lower right corner on the Bot Builder.
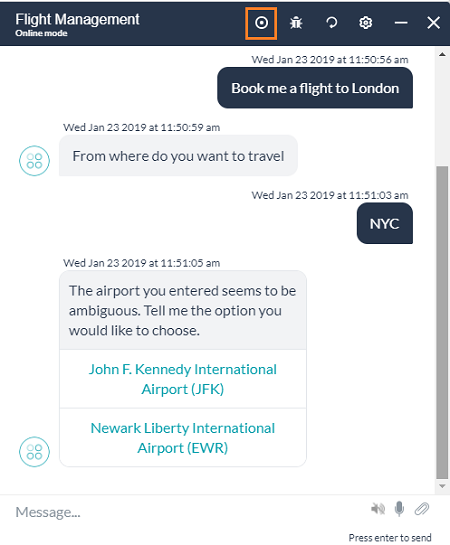
A messaging window for the bot is displayed and connected to the NLP interpreter as shown in the following illustration for the Flight Management Bot.
When you first open the window, the Bot Setup Confirmation Message field definition for the bot is displayed, if defined. In the Message section, enter text to begin interacting and testing your bot, for example, Book a flight.
The NLP interpreter begins processing the task, verifying authentication with the user and the web service, and then prompting for required task field information. When all the required task fields are collected, it executes the task.
While testing your bot, try different variations of user prompts and ensure the NLP interpreter is processing the synonyms (or lack of synonyms) properly. If the bot returns unexpected results, consider adding or modifying synonyms for your tasks and task field names as required. For more information, see Natural Language Processing.
Troubleshooting
You can open a debug window to view the natural language processing, logs, and session context and variables of the chat. To open the debug, click the Debug icon ![]() located on the top right-hand side of the Talk to Bot chat window. The Debug window consists of the following tabs: Debug Log, NL Analysis, Session Context & Variables.
located on the top right-hand side of the Talk to Bot chat window. The Debug window consists of the following tabs: Debug Log, NL Analysis, Session Context & Variables.
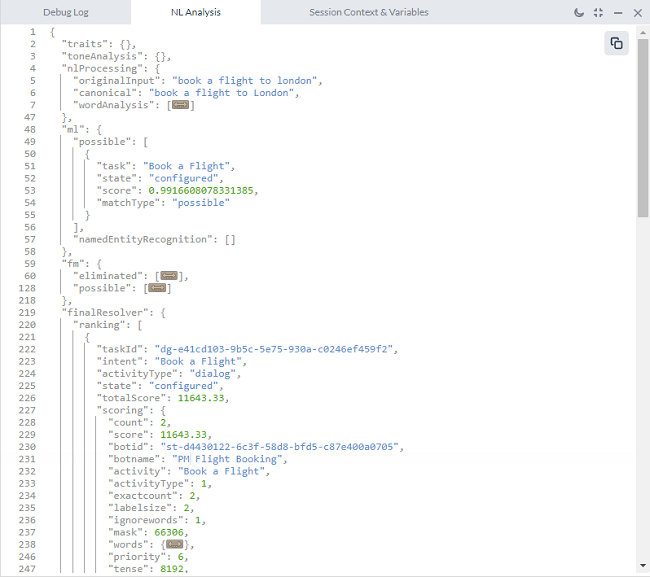
- NL Analysis: Describes the bot tasks loading status, and for each utterance presents a task name analysis and recognition scores.
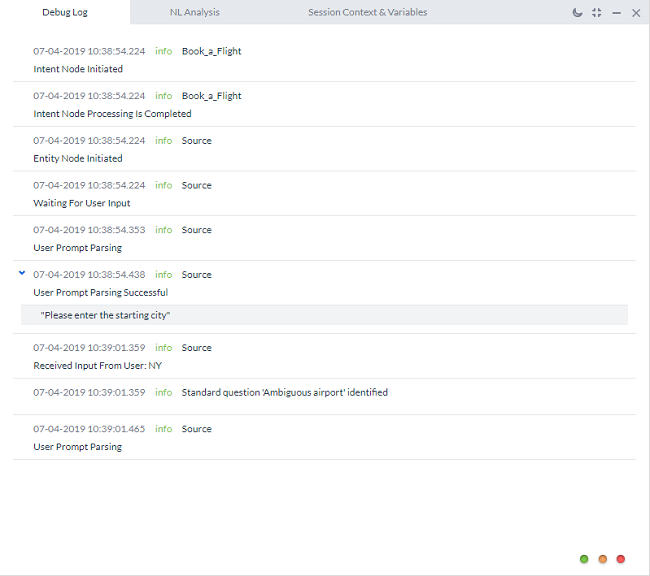
- Debug Log: Lists the processing or processed Dialog task components along with a date timestamp.
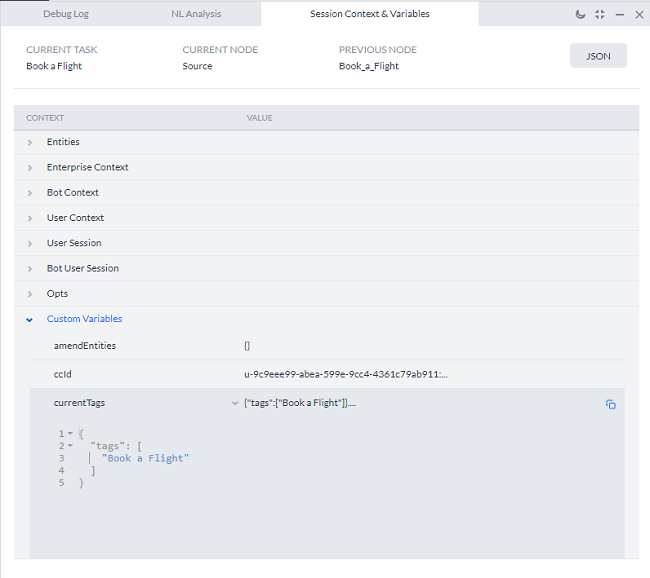
- Session Context & Variables: Shows both context object and session variables used in the dialog task processing.
Debug Log
Debug Log provides the sequential progression of a dialog task and context and session variables captured at every node. The Debug log supports the following statuses:
- processing: The Bots Platform begins processing of the node
- processed: The node and node connections are processed, the following node is found but the dialog has not yet moved to that node.
- waitingForUserInput: The user was prompted for input
- pause: The current dialog task is paused while another task is started.
- resume: The current dialog with paused status continues at the same point in the flow after completion of another task that was started.
- waitingForServerResponse: The server request is pending an asynchronous response.
- error: An error occurred, for example, the loop limit is reached, a server or script node execution fails.
- end: The dialog reached the end of the dialog flow.
NL Analysis
NL Analysis tab shows the task name analysis and recognition scores of each user utterance. It presents a detailed tone analysis, intent detection, and entity detection performed by the Kore.ai NLP engine. As a part of intent detection, the NL Analysis tab shows the outcomes of Machine Learning, Fundamental Meaning, and Knowledge Graph engines. For a detailed discussion on the scores, see Training Your Bot topic.
Session Context and Variables
The Session Context & Variables tab displays dynamically the populated Context object and session variables updated at each processed component in Dialog Builder. The following is an example of the Session & Context Variables panel in Debug Log. For more information about the parameters, see Using Session and Context Variables in Tasks and Context Object.
Record
Record option allows you to record conversations to help in regression testing scenarios. More…

