Kore.ai records and presents all the information as part of the Bot Analyze section. Developers can gain in-depth insights into their bot’s performance at identifying and executing tasks. It lets you view necessary information for user utterances that matched and didn’t match with intents.
The Analyze -> Metrics section contains the following sections:
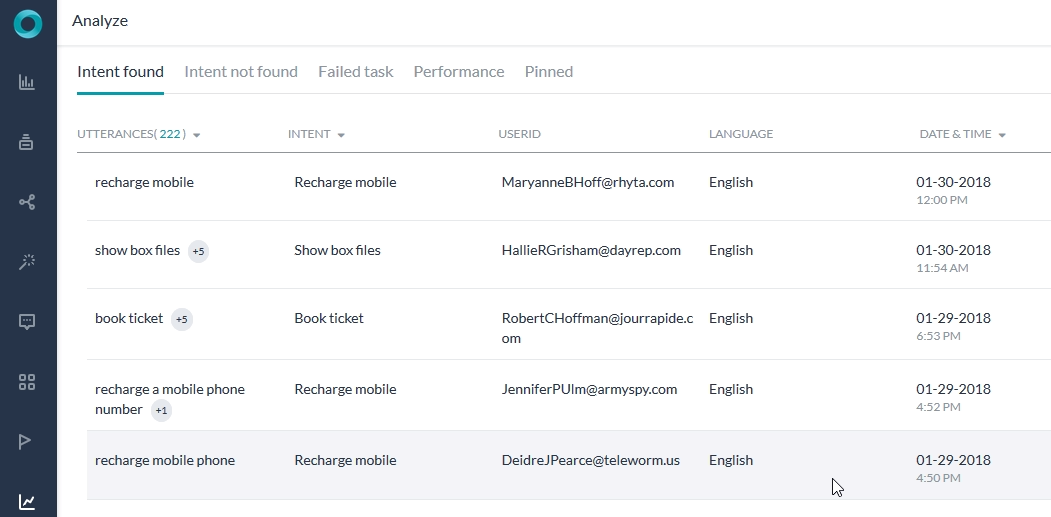
- Successfully handled User utterances: Contains all the user utterances that were successfully mapped to a trained intent, including the dialog tasks triggered by KG intents. The utterances are grouped together based on similarity
- You can filter the information based on various criteria such as Intent, user (Kore user id or channel specific unique id), date-period, channel of use, and language. Records can also be filtered on multiple custom tags.
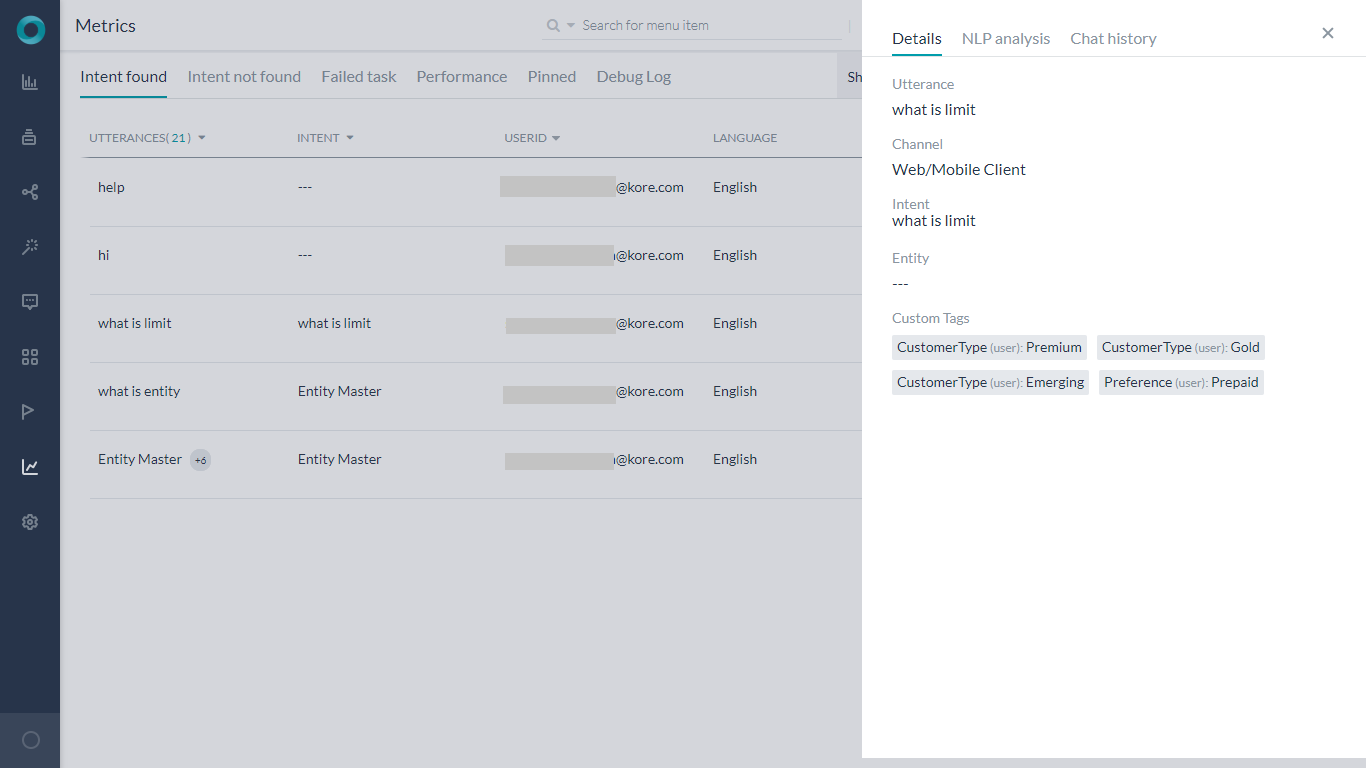
- Complete meta information is stored for later analysis including the original user utterance, the channel of communication, entities extracted if any, custom tags applied, detailed NLP analysis with scores returned from each engine and the ranking and resolver scores.
- Ability to view the chat transcript to the point of the user utterance.
- Un-handled User utterances: Contains all the user utterances that platform was not able to map to a bot intent/FAQ. These are grouped together based on similarity for the developer to train based on occurrence count.
- You can filter information based on various criteria such as user (Kore user id or channel specific unique id), date-period, channel of use, and language. Records can also be filtered on Multiple custom tags.
- Complete meta information is stored for later analysis including the original user utterance, the channel of communication, system entities extracted if any, custom tags applied, detailed NLP analysis with scores returned from each engine and the ranking and resolver scores.
- Ability to view the chat transcript to the point of the user utterance.
- The developer will have an option to train the utterance and once trained the utterance will be marked. The developer can also filter based on trained / untrained utterances.
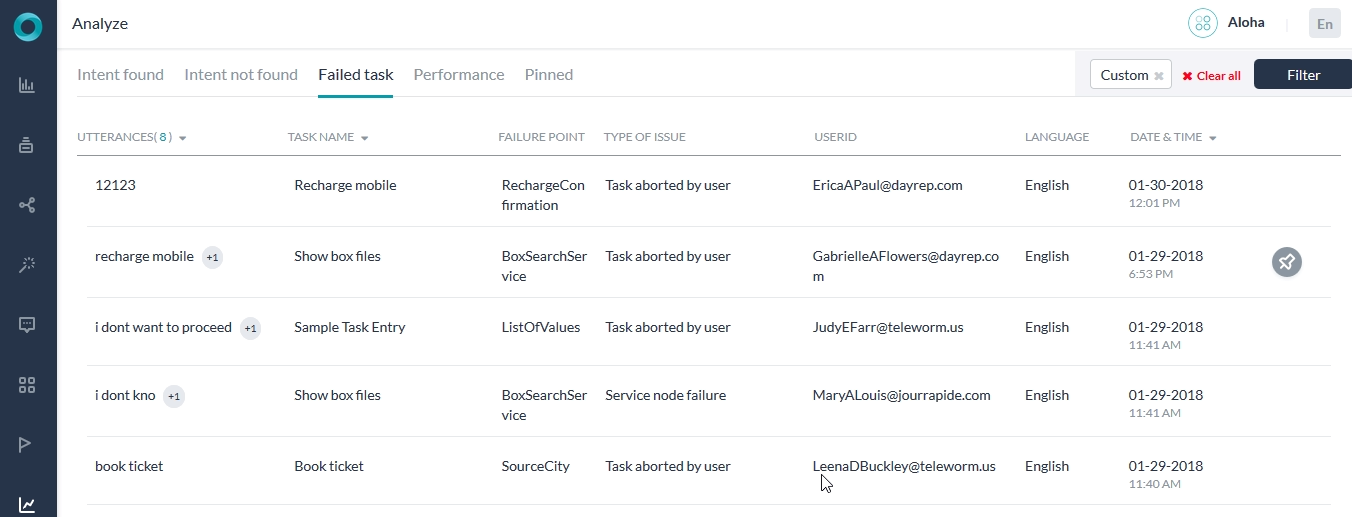
- Task Execution Failure: All the user utterances that were successfully identified to intent, but the task could not be completed are listed under this section. The developer can group based on task and failure types to analyze and solve issues with the bot.
- The supported platform failure types are:
- Task aborted by user
- Alternate task initiated
- Chat Interface refreshed
- Human agent transfer
- Authorization attempt failure – Max attempts reached
- Incorrect entity failure – Max attempts reached
- Script failure
- Service failure
- Information can be filtered as above
- In addition to the meta information as in handled and unhandled scenarios, the platform also captures the path of traversal of the user in the dialog.
- The supported platform failure types are:
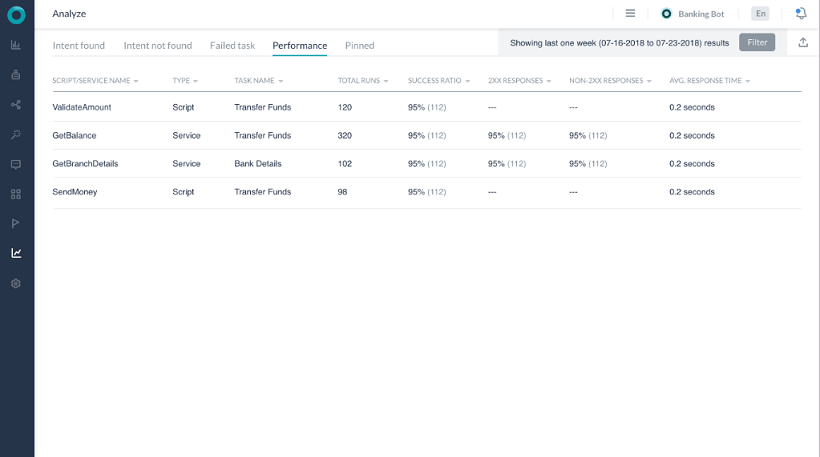
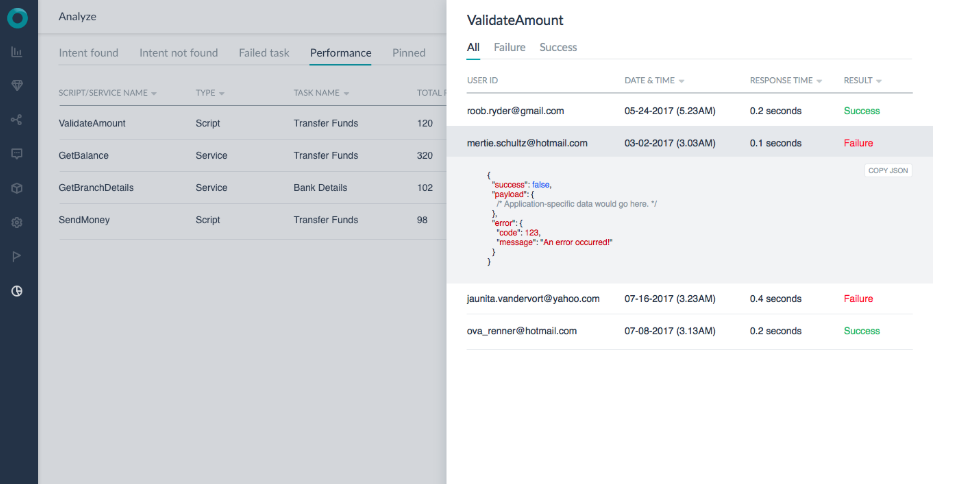
- Script and Service Performance: Developers can monitor all the scripts and API services across the bot tasks from a single window. The platform stores the following meta information:
- Total number of runs
- Success %
- The total number of calls with 200 response and the total number of calls with a non-200 response. The actual response code can be viewed from the details page which opens when the service row is clicked.
- Average Response times
- Appropriate alerts if a script or a service is failing consecutively
To open the Metrics page, hover over the side navigation panel and click Analyze -> Metrics.
Post ver 7.1, to facilitate easier review of the Bot’s performance, the end-user utterances are grouped based on similarity.
Filter Criteria
You can filter the information on the Metrics page using the following criteria.
| Criteria | Description |
|---|---|
| User ID | The UserID of the end-user related to the conversation. You can choose to filter based on the
You can select the user id from the drop-down that would be presented once you have entered the first three alphabets of the user id. Note: Channel specific ids are shown only for the users who have interacted with the bot during the selected period. |
| Date period | The page shows the conversations from the last 7 days by default. To filter the conversation to just the ones from the last 24 hours, click 24 Hrs. To switch back to the sessions from the last 7 days, click Last 7 days. You can also add a Custom time period by specifying from and to Date and Time (Time added in ver7.3) |
| Languages | If it is a multi-language bot, you can select specific languages to filter the conversation that occurred in those languages. The page shows the conversations that occurred in all enabled languages by default. |
| Channel | Select specific channels to filter the conversation that occurred in those channels. The page shows the conversations that occurred in all enabled channels by default. |
| Task/Intent | Select specific tasks or intents to filter the conversation related to those tasks or intents. The page shows the conversations related to all tasks or intents by default. |
| Utterance Type | Select the Trained option to filter the conversations that only contained trained utterances to the bot. To view the conversations that involved untrained utterances, click Not Trained. The page shows the conversations related to both by default. Not available on the Performance tab. |
| Ambiguous
(post v7.0 release) |
Select the Show Ambiguous option to filter the conversations that identify multiple tasks or intents and asked the user to choose from the presented options.
Available only on the Intent Not Found tab. |
| Developer Interactions | Select Include Developer Interactions if you want to include developer interactions in the results. By default, the developer interactions aren’t included. Developers include both the bot owner and shared developers. |
| Custom Tags (post v6.4.0 release) |
Select the specific custom tags to filter the records based on the meta information, session data, and filter criteria. You can add these tags at three levels:
You can define Tags as key-value pairs from Script written anywhere in the application like Script node, Message, entity, confirmation prompts, error prompts, Knowledge Graph responses, BotKit SDK etc. etc.
|
Identified and Unidentified Intents
The primary details, filter criteria, and the advanced details for both the Intent Found and Intent Not Found are similar, with minor differences. You can also train the bot for any utterances directly from these tabs.
Primary Details
| Field | Description |
|---|---|
| Utterances | The actual utterance entered by the user. The details in the tab are grouped by utterances by default. To turn off grouping by utterance, click the Utterances header and turn off the Group by Utterances option. |
| Intent (applies only to the Intent Found tab) |
The intent that was identified for the user utterance. You can take a look at the identified intent and the user utterance to determine if they are the right match. If not, you can train the bot from here. To turn on grouping by intent, click the Intent header and turn on the Group by Task option. |
| UserID | The UserID of the end user related to the conversation. You can choose to display the metrics based on either Kore user id or channel specific unique id.
Note: channel specific ids are shown only for the users who have interacted with the bot during the selected period. |
| Language | The language in which the conversation occurred. |
| Date & Time | The date and time of the chat. |
Training the Bot
You can train an intent from both the Intent Found and Intent Not Found tabs. To do so, hover over a row in any of these tabs, and click the Train icon. It opens the Test & Train page from where you can train the bot. For more information, read Testing and Training a Bot.
Failed Tasks
The Failed Tasks tab shows the following details related to the task that was identified but failed to execute for any reason:
| Field | Description |
|---|---|
| Utterances | The actual utterance entered by the user. The details in the tab are grouped by utterances by default. To turn off grouping by utterance, click the Utterances header and turn off the Group by Utterances option. |
| Task Name | The task that was identified for the user utterance. To turn on grouping by task name, click the Task Name header and turn on the Group by Task option. |
| Failure Point | Nodes or points in the task execution journey where the failure occurred resulting in the task cancellation or user drop. Click an entry to view the complete conversation for that session with markers to identify the intent detection utterance and the failure/drop-out point. Depending on the task type, click Failure Point shows more details. |
| Type of Issue | Shows one of these options as the reason for failure:
|
| User ID | The UserID of the end user related to the conversation. You can choose to display the metrics based on either Kore user id or channel specific unique id.
Note: channel specific ids are shown only for the users who have interacted with the bot during the selected period. |
| Language | The language in which the conversation occurred. |
| Date & Time | The date and time of the chat. |
Advanced View – NLP Analysis and Chat History
For all the user utterances listed under the Intent found, Intent not found, and Failed Task tabs, you can open advanced details related to the user session with the following sub-tabs:

- Details: Shows the basic details of the session along with a JSON file that includes the NLP analysis for the conversation.
- NLP Analysis: Provides a visual representation of the NLP analysis including intent scoring and selection. For more information, read Testing and Training a Bot.
- Chat history: Directs you to the exact message or conversation for which the record is logged and shows the entire chat history of the user session.
Performance
The Performance tab shows the following information related to the backend performance of the bot:
| Field | Description |
|---|---|
| Node Name | The name of the service or script or WebHook within the task that got executed in response to the user utterance. To turn on grouping by components to which these scripts or services belong, click the Node Name header and turn on the Group by Component option. |
| Type | Shows whether it is a script or service or WebHook.
NOTE: WebHook details are included from ver 7.0. |
| Task | The task that was identified for the user utterance. To turn on grouping by task name, click the Task Name header and turn on the Group by Task option. |
| Total Runs | The total number of times within the date period that the script or service was run for any user utterances. |
| Success Ratio | The percentage of the service or script runs that got executed successfully. |
| 2XX Responses | The percentage of the service or script runs that returned 2xx response. |
| Non-2XX Responses | The percentage of the service or script runs that returned non-2xx response. |
| Average Response Time | The average response time of the script or service in the total number of runs. |
Advanced Performance Details
Clicking a service or script or WebHook name opens advanced details dialog for the service which lists each instance of its run along with separate tabs for successful and failed runs. Analyzing the average response time of different runs gives you insights into any aberrations in the service or script execution. Click any row to open the JSON response associated with the service or script run.
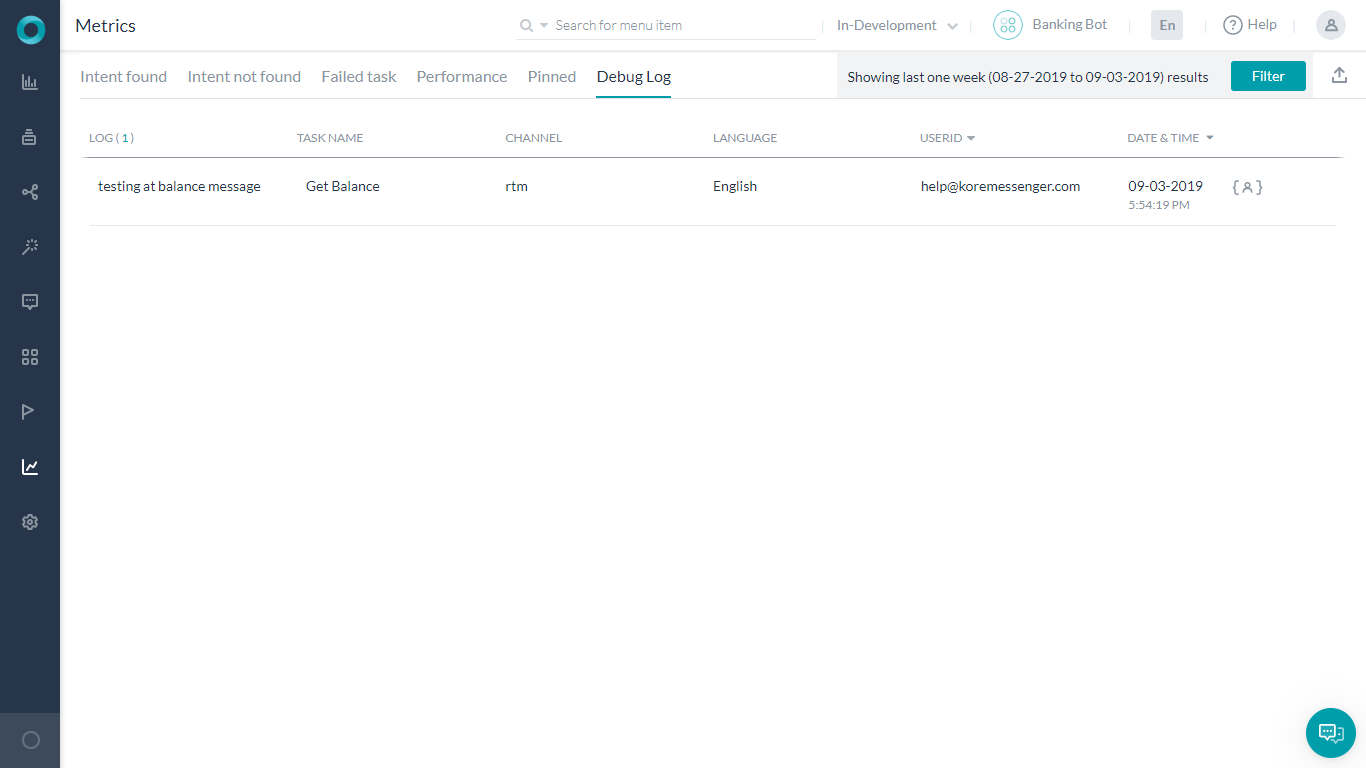
Debug Log
(Introduced in ver 7.1)
Any custom debug statements that you entered in the Script node using koreDebugger.log("<debug statement>") statements will be displayed in this tab (debug statement should be in a string format).
The logs will include the user conversation from across all channels. You can use them for bot analysis especially in case of failures during user interaction.
The details include:
- The actual statement that the you have defined at the time of Bot definition
- Date and time of logging
- Channel
- User ID (along with channel-specific id)
- Language of interaction
- Task name if available
- Developer flag – to indicate if the interaction was performed by a developer or end user.
For universal bots, the debug statements from the universal and linked bots will be included in the logs.
Post v7.2 release, the debug logs will include the error messages related to BotKit, like, when the platform could not reach the BotKit or when the BotKit did not acknowledge the message sent by the platform. The message would include the details like the <endpoint>, <error code>, and <response time>.
Storage Limitations
The platform imposes restrictions on the number of log statements retained per bot. The limit is a combination of volume and period:
- Only latest 700 statements per bot are stored
- Statements older than 7 days will be removed
Exporting the Data
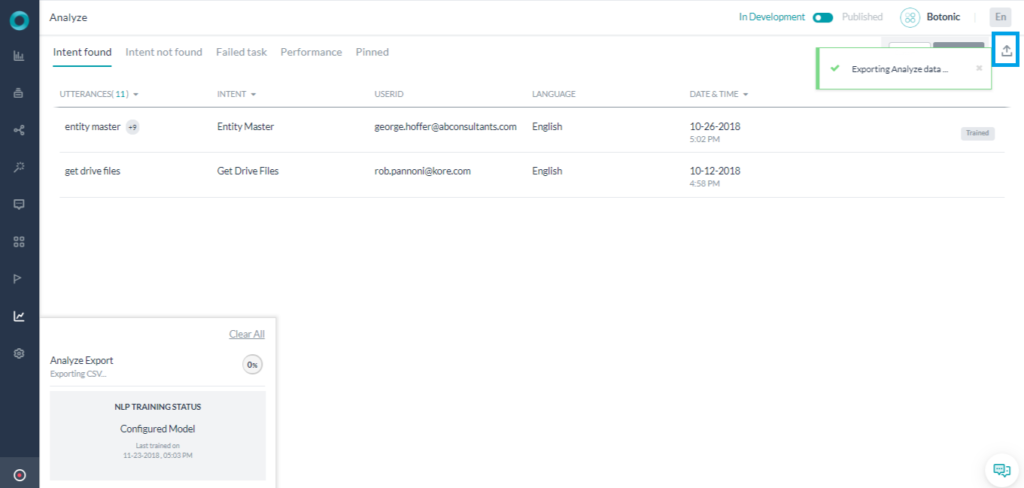
You can export the data present in Bot Analyze page to a CSV file by clicking the Export icon on the top right corner of the page.
Once you click the icon, the export process starts and you can use the Status Tracker dock to track the export progress. After completion of the export, the dock shows export status and if it’s successful provides a link to download the file.
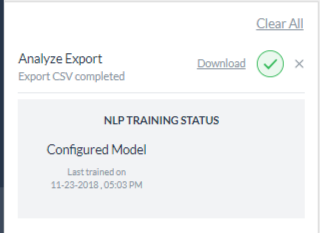
The download includes the information present on the selected tab as well as the detailed analysis based on the selected filters.
Post ver7.1 release of the platform, these records will include the Meta Tag information also.

