Let’s create a dashboard using various metrics to analyze the performance of a Virtual Assistant and identify trends for business needs using a Banking Bot as an example.
Problem Statement
As a Banking Bot client, you want to track the following metrics:
- Dollar Value Breakup
- Customer Type Summary
- Task Fulfillment Trend
- Top Failure Tasks
- Channel Volume Trend
- Filter the Messages using the Having clause
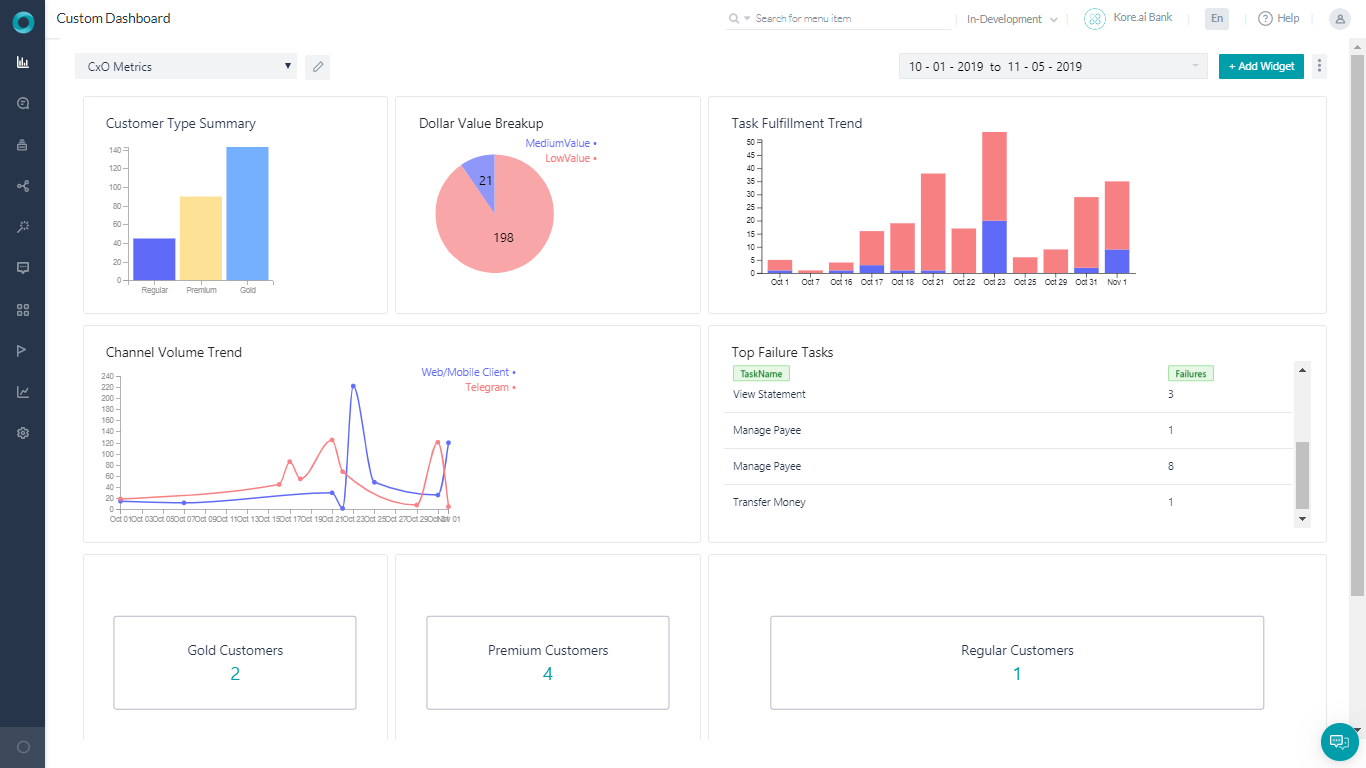
You can create a custom dashboard to achieve all the scenarios listed above, with detailed step-by-step instructions as described in the following sections.
Once the Dashboard is configured for the listed scenarios, it looks like below.
Pre-requisites
- Bot building knowledge.
- Custom Meta Tags usage. See here for more information.
- A Banking Bot with the dialogs as follows:
- Transfer Funds – The Dialog task walking the user through the steps in transferring money.
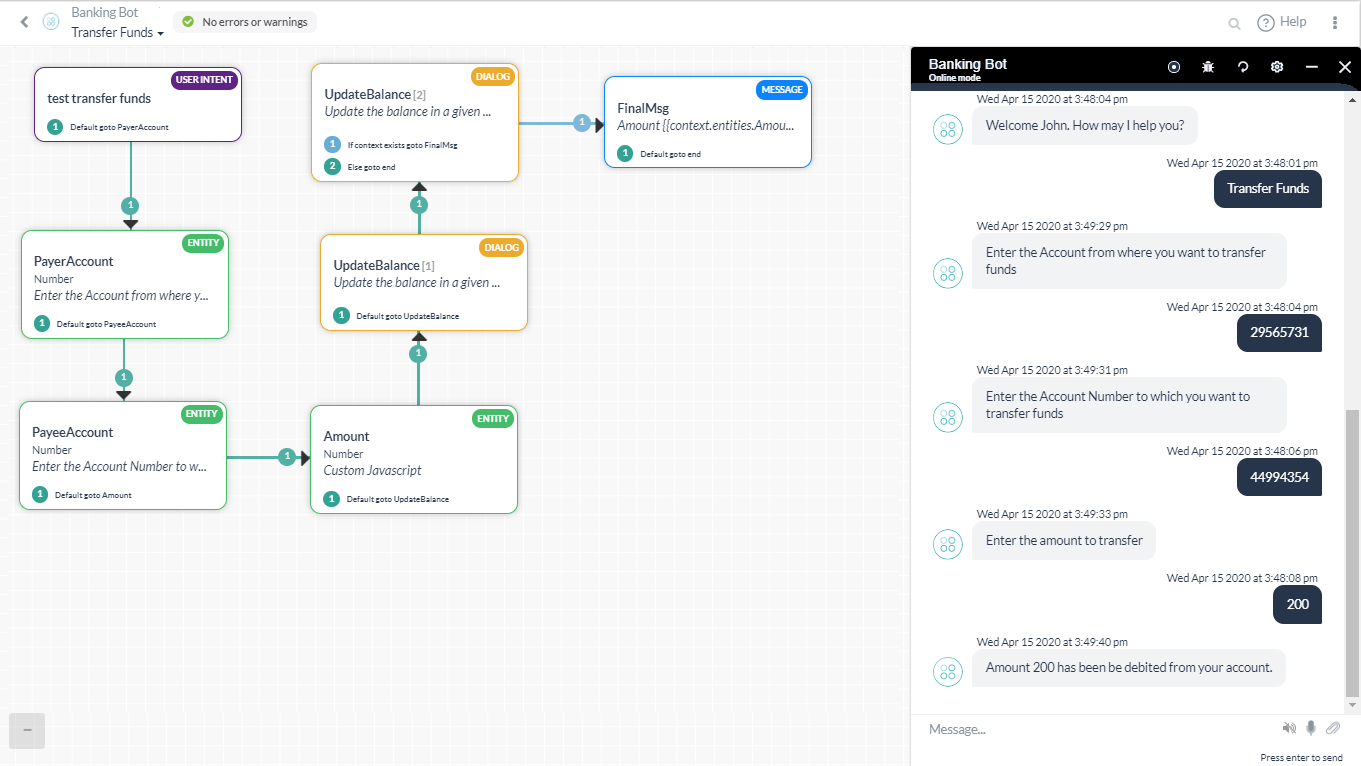 In this diaog, we have included a Script node to add Custom Meta Tag, TransferValue, based upon the amount transferred. The following script is used:
if(context.entities.TransferAmount[0].amount > 50000){
   tags.addSessionLevelTag("TransferValue","HighValue");
}

if(context.entities.TransferAmount[0].amount > 10000)
tags.addSessionLevelTag("TransferValue","MediumValue");

if(context.entities.TransferAmount[0].amount > 0)
tags.addSessionLevelTag("TransferValue","LowValue");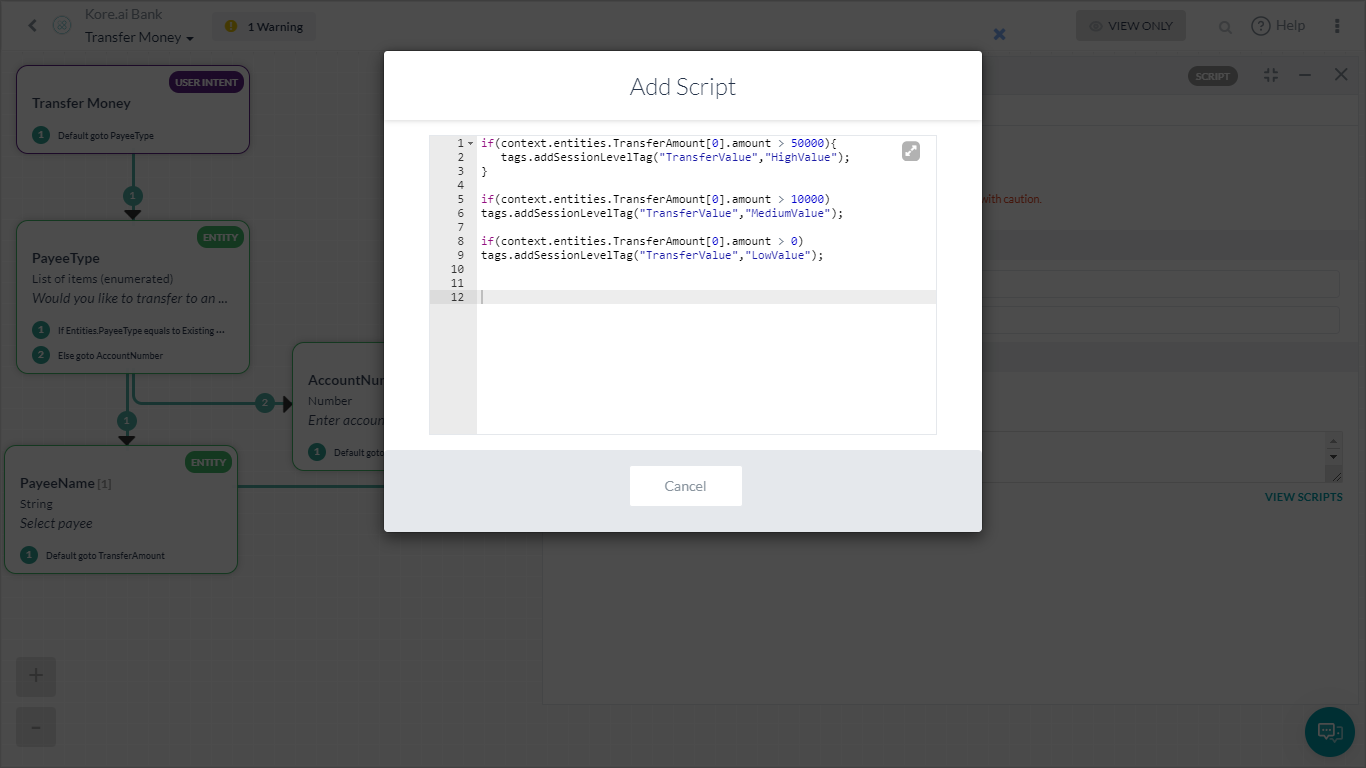
- Manage Payee – For the user to manage their payee list.
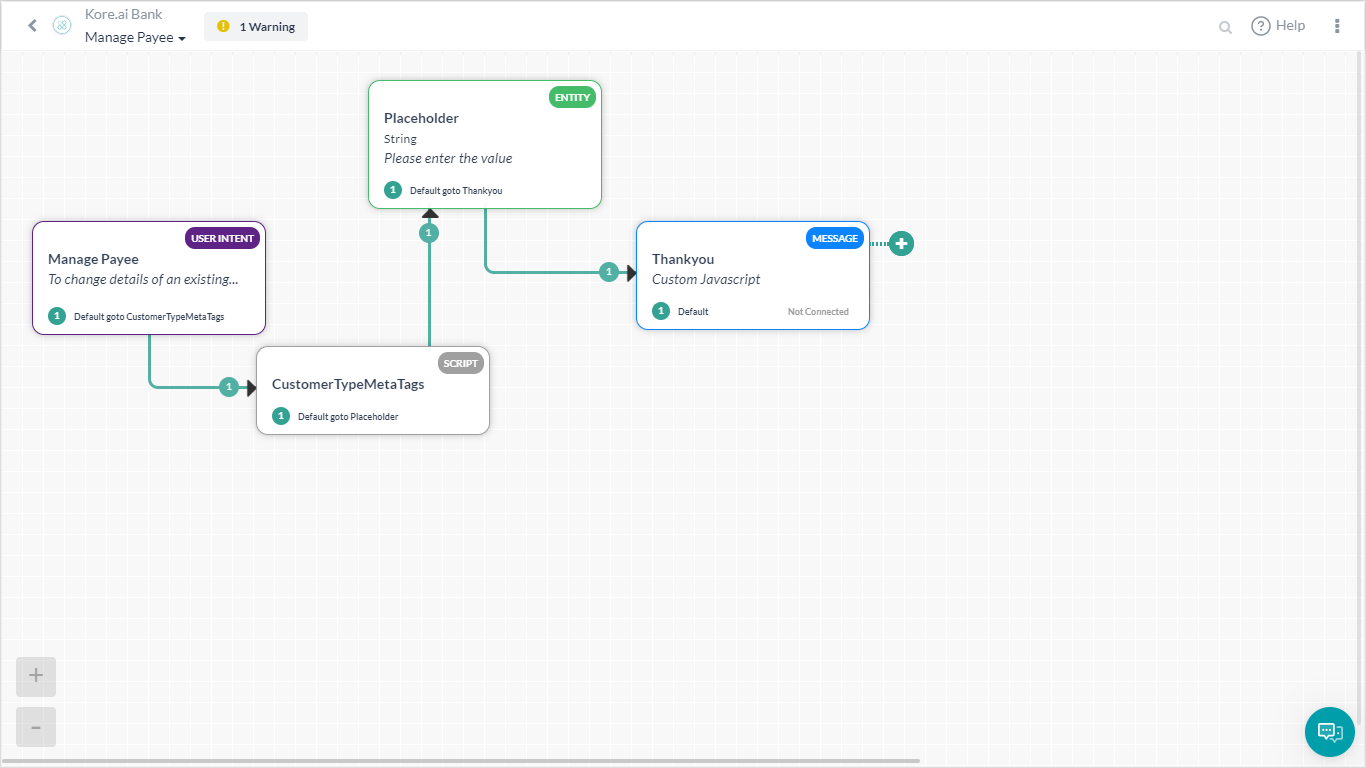
Here we have a Script that assigns a value to the customerType meta tags:
if(context.custType == 3){
   tags.addUserLevelTag("CustomerType","Premium");
}
if(context.custType == 2){
   tags.addUserLevelTag("CustomerType","Gold");
};
if(context.custType == 1){
   tags.addUserLevelTag("CustomerType","Regular");
};
- Transfer Funds – The Dialog task walking the user through the steps in transferring money.
Implementation
Let’s consider how each metric mentioned in the problem statement can be implemented using widgets from the Custom Dashboard.
- From the left navigation panel, under Dashboard click Custom Dashboard.
- Create New Dashboard.
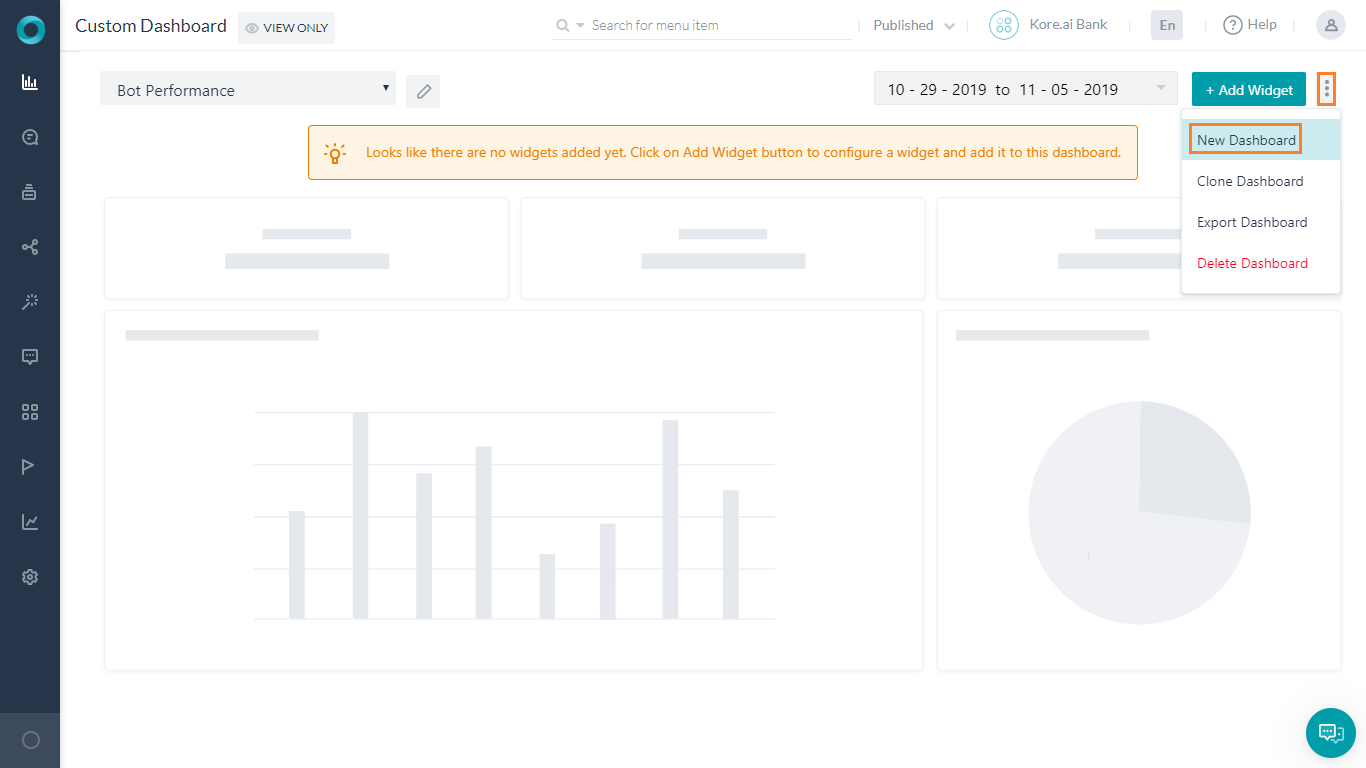
- Use the Add Widget button to add widgets for each of the above scenarios.
The details for each widget are explained in the following sections.
Dollar Value Breakup
- Add Widget
- Query setup:
- Dataset – Analytics
- Select – sessionTag.TransferValue as TransferValue,count(taskName)
This will let the platform know what data to fetch. Here we are using the session tag values added to the Transfer Amount task against the total number of tasks executed. - Group By – sessionTag.TransferValue
- Run to see the results from the above query.
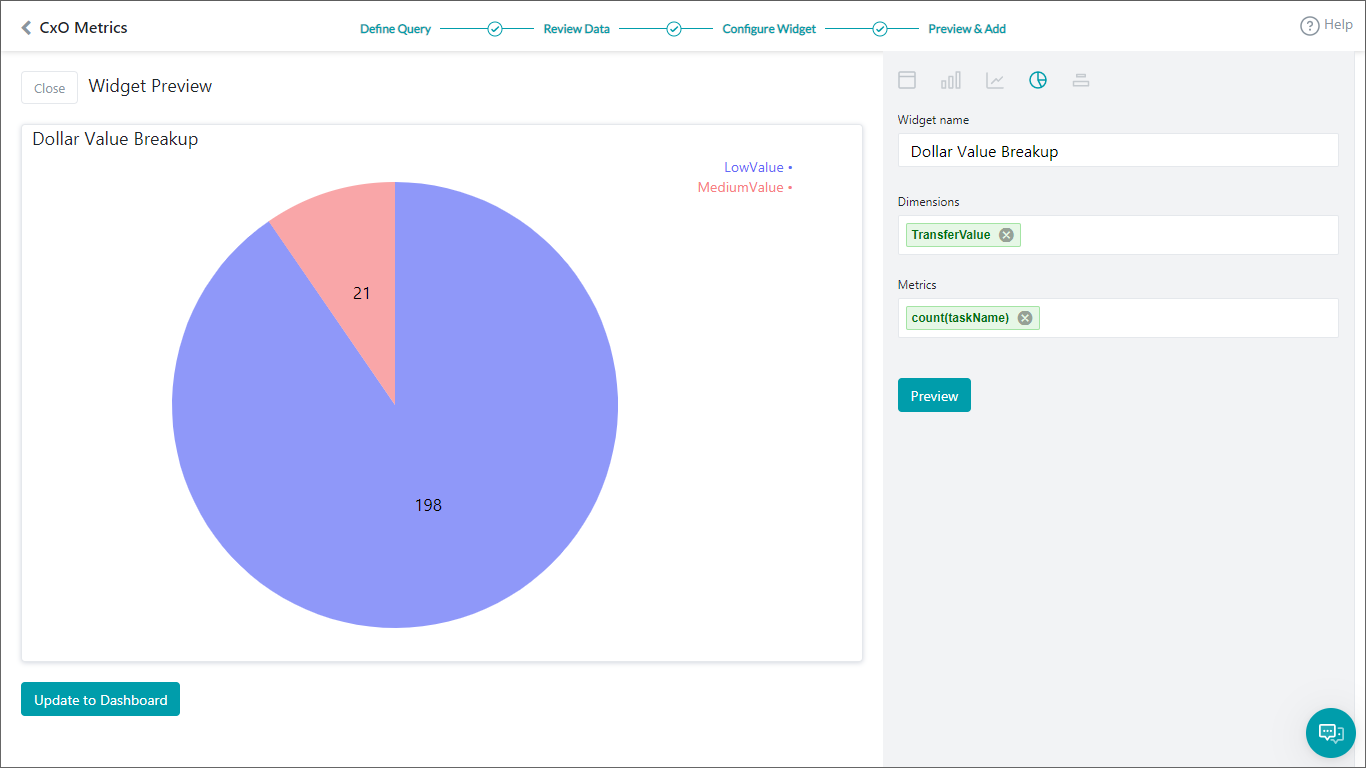
- Widget Setup
- Select Pie chart
- Set Dimension to TransferValue
- Set Metrics to count(taskName)
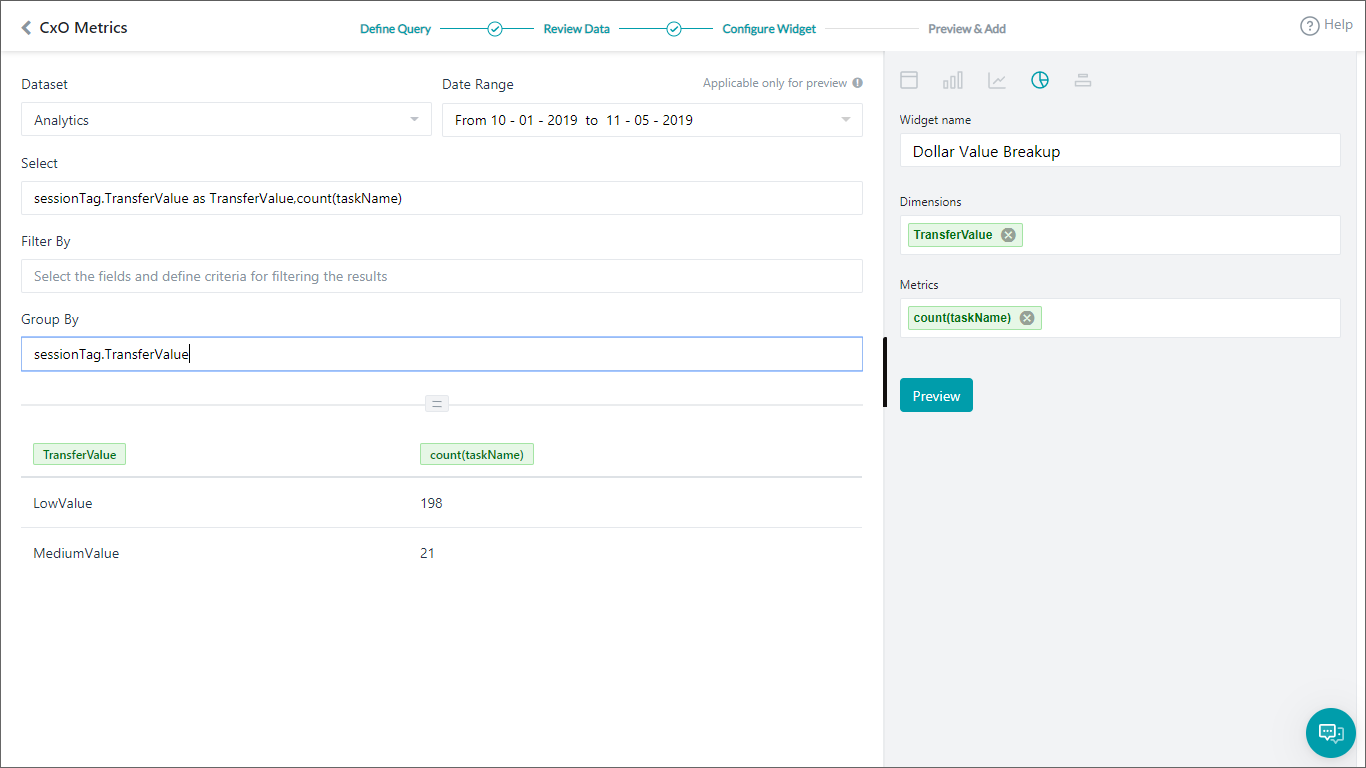
- See the Preview and if all is fine, click Update to Dashboard
Customer Type Summary
This query provides usage statistics based on the customer type.
Repeat the steps listed in the previous section (Dollar Value Breakup) with the following details:
- Add Widget
- Query setup:
- Dataset – Analytics
- Select – userTag.CustomerType as CustomerCategory, count(taskName)
- Group By – userTag.CustomerType
- Run to see the results from the above query.
- Widget Setup
- Select Bar chart
- Set Dimension to CustomerCategory
- Set Metrics to count(taskName)
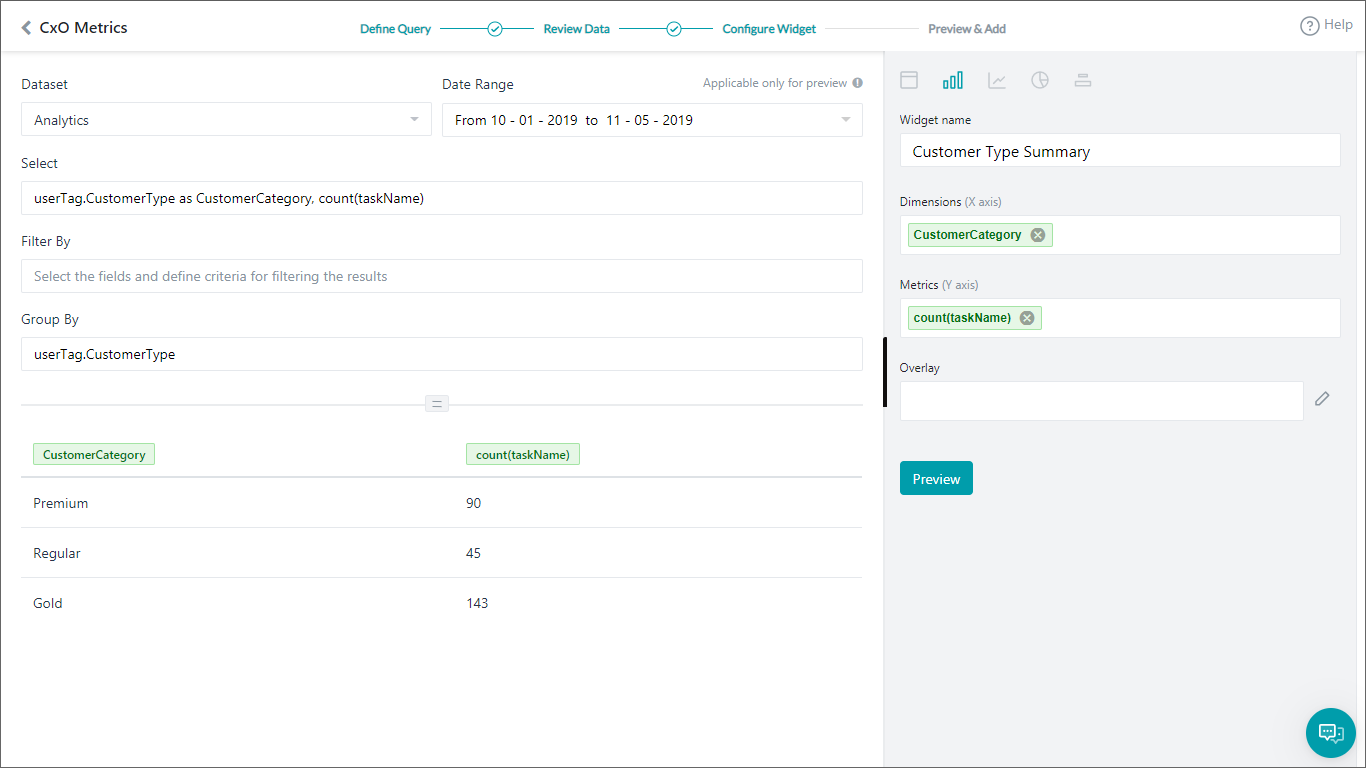
- See the Preview and then click Update to Dashboard
Task Fulfillment Trend
This query provides day-wise task success vs. failure trends.
Repeat the steps listed in the previous section with the following details:
- Add Widget
- Query setup:
- Dataset – Analytics
- Select – date,metricType, count(metricType) as TotalTasks
- Filter By – metricType = ‘successtasks’ or metricType = ‘failedtasks’
We want to see only Success or Failed Tasks - Group By – date,metricType
- Run to see the results from the above query.
- Widget Setup
- Select Bar chart
- Set Dimension to date
- Set Metrics to TotalTasks
- Set Overlay to metricType
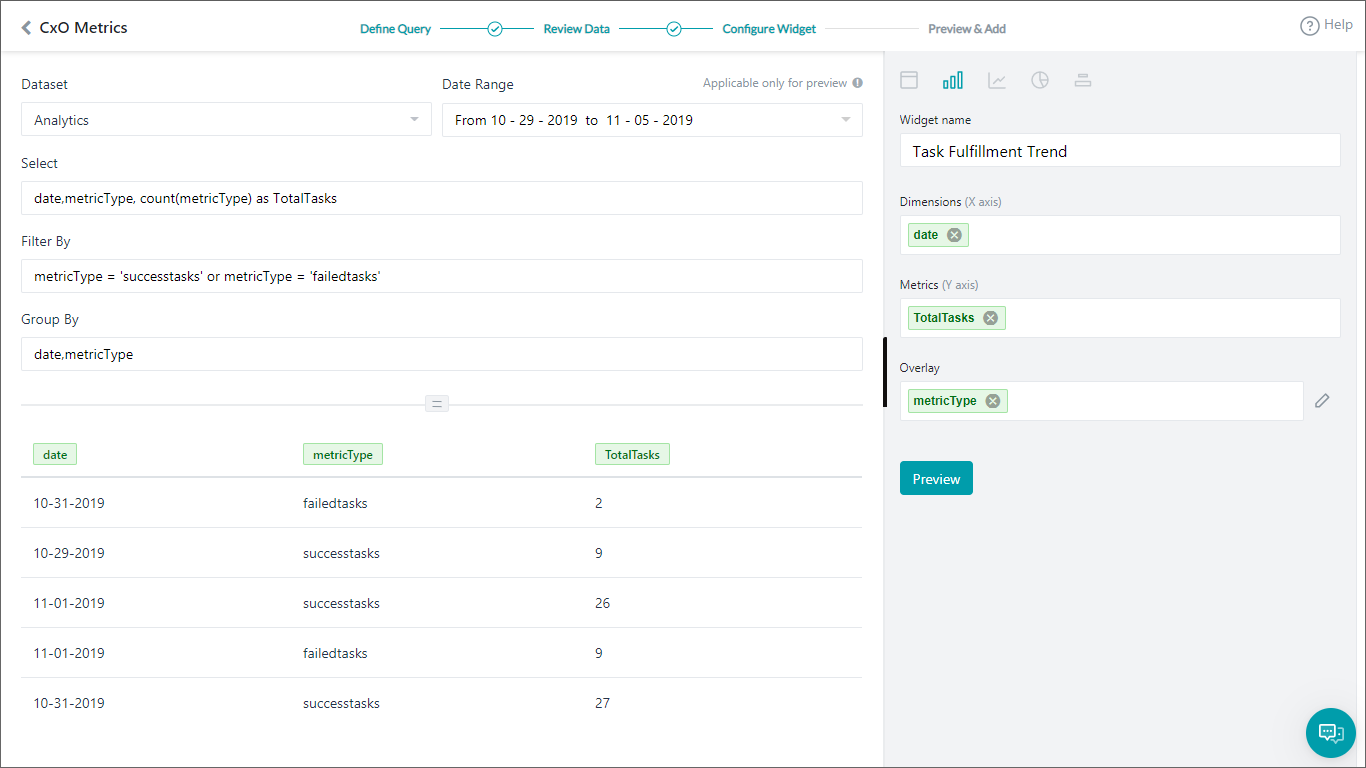
- See the Preview and then click Update to Dashboard.
Top Failure Tasks
This query provides top tasks that are failing.
Repeat the steps listed in the previous section with the following details:
- Add Widget
- Query setup:
- Dataset – Analytics
- Select – taskName as TaskName,count(taskName) as Failures
- Filter By – metricType = ‘failedtasks’
We want to see only Failed Tasks - Group By – taskName
- Run to see the results from the above query.
- Widget Setup
- Select Table chart
- Set Dimension to TaskName and Failures
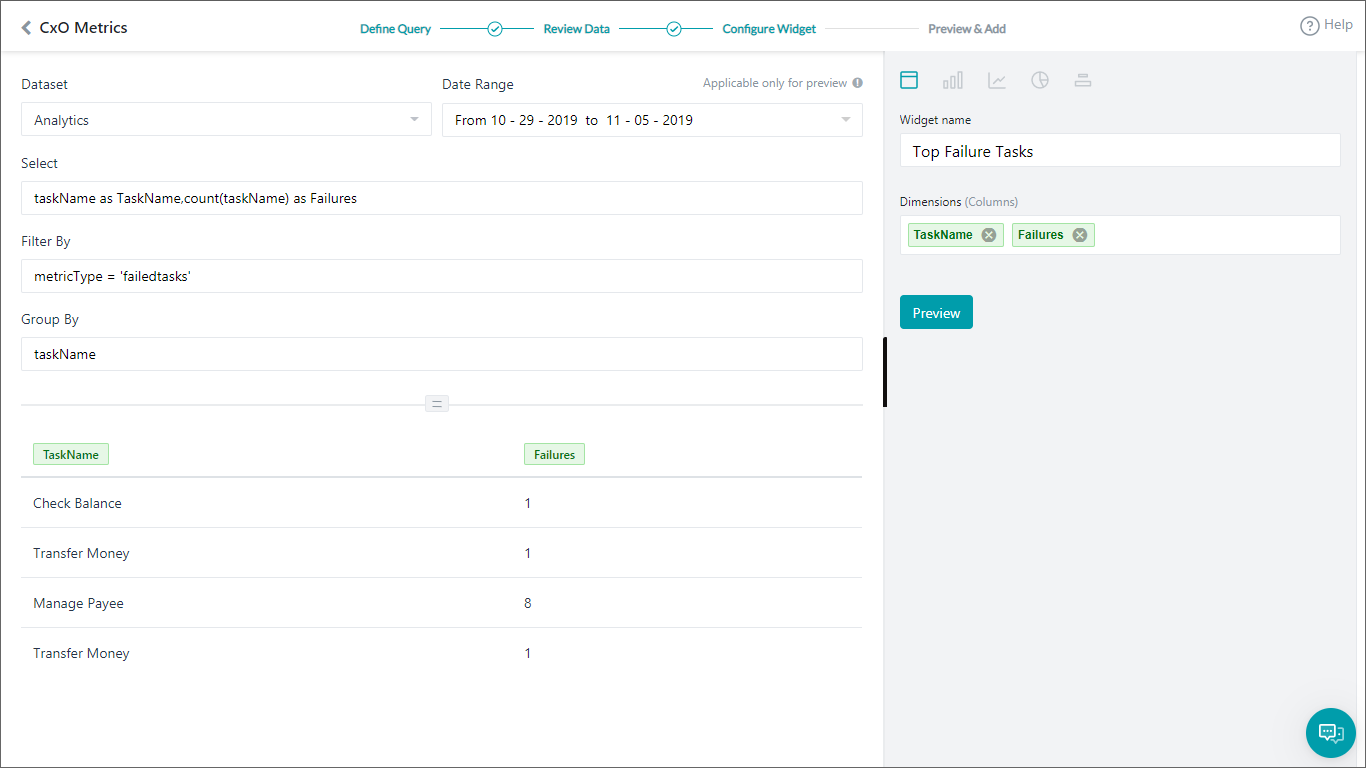
- See the Preview and then click Update to Dashboard
Channel Volume Trend
This query provides channel-wise usage details.
Repeat the steps listed in the previous section with the following details:
- Add Widget
- Query setup:
- Dataset – Messages
- Select – date,channel,count(messageId)
- Group By – date,channel
- Run to see the results from the above query.
- Widget Setup
- Select Line chart
- Set Dimension to date
- Set Metrics to count(messageId)
- Set Overlay to channel
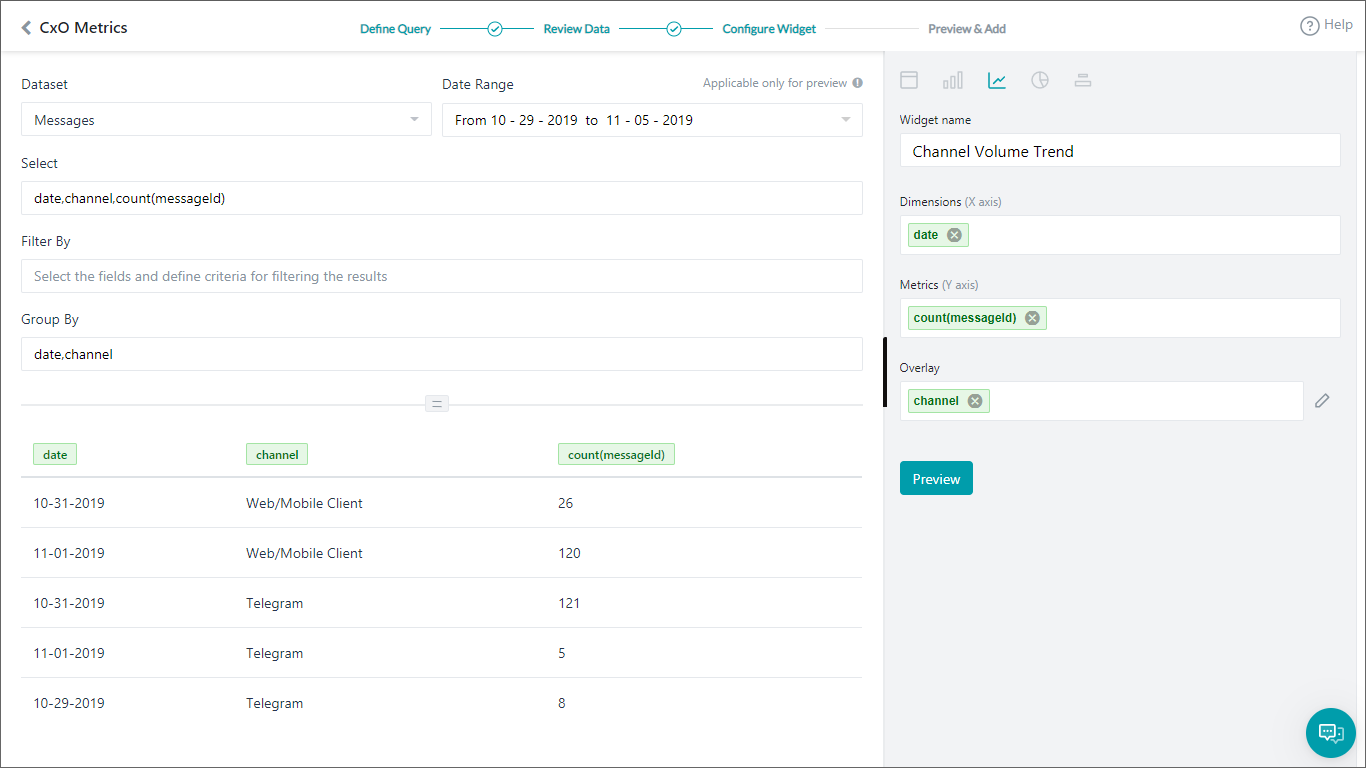
- See the Preview and then click Update to Dashboard
You Custom Dashboard is ready. Set the Date Range to see the required metrics for the scenarios.
Filter the Messages using the Having Clause
This query uses a Having clause, to display the number of filtered messages for userIds, where the user has interacted with the virtual assistant more than 12 times. The query setup and result are described below.
Repeat the steps listed in the previous section with the following details:
- Add Widget
- Query setup:
- Dataset – Messages
- Select – count(messageId),userId
- Group By – userId
- Having – count(messageId) > 12
- Run to see the results from the above query.
- Widget Setup
- Select Table chart
- Set Dimension to count(messageId),userId
- The following is a result when you just retrieve the count of all messages, grouping by the userId.

- The following is a result when you retrieve the count of messages, grouping by the userId, using the Having clause.

- See the Preview and then click Add to Dashboard.

The Having clause widget is added to the dashboard as shown in the following screenshot.
